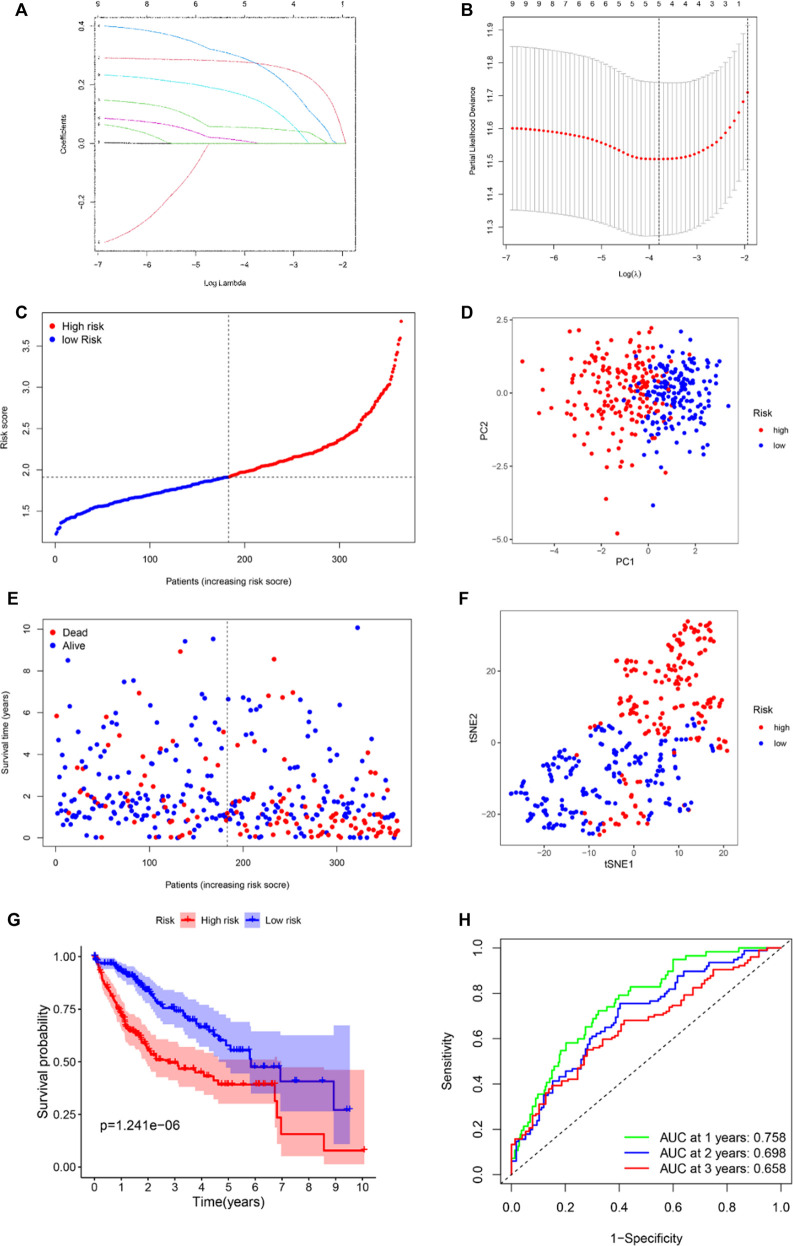
FIGURE 3.
Establishment of ferroptosis-related hub gene signature in the TCGA set. (A) LASSO coefficient profiles of the expression of 41 candidate genes. (B) Selection of the penalty parameter (λ) in the LASSO model via 10-fold cross-validation. An optimal log λ value is indicated by the vertical black line in the plot. Risk score distribution (C), PCA plot (D), overall survival (OS) status (E), and t-SNE (F) analysis of TCGA cohort. (G) Kaplan–Meier curves for comparison of the OS between low- and high-risk groups. (H) Receiver operating characteristic (ROC) curves verified the prognostic performance of the risk score.

