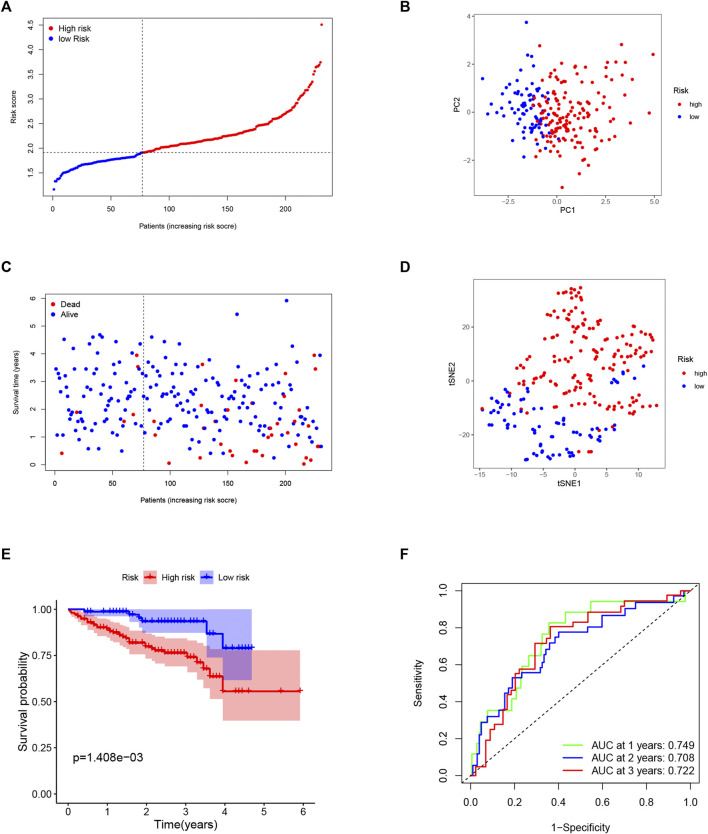
FIGURE 4.
Validation of the 5-gene signature in the ICGC cohort. (A) The distribution and median value of the risk scores in the ICGC cohort. (B) The distributions of overall survival (OS) status. (C) PCA plot of the ICGC cohort. (D) t-SNE analysis of the ICGC cohort. (E) Kaplan–Meier curves for the OS of patients in the high- and low-risk groups. (F). ROC curves in the ICGC cohort.

