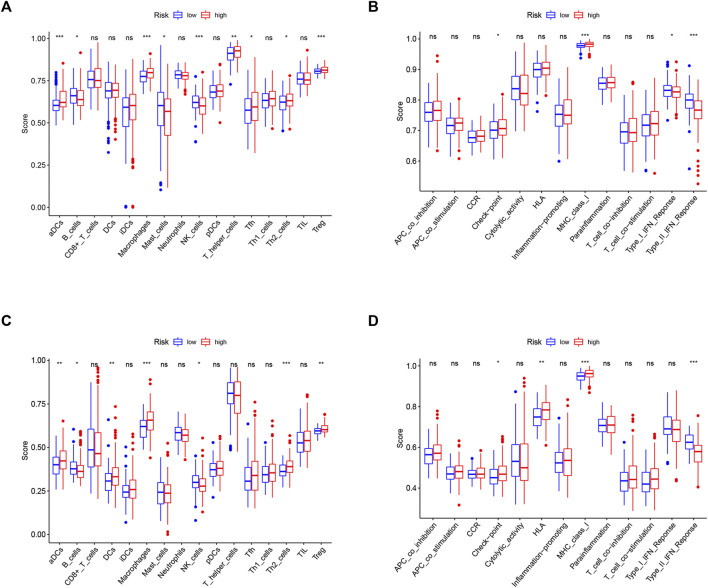
FIGURE 8.
Comparison of the ssGSEA scores between different risk groups in the TCGA cohort (A,B) and ICGC cohort (C,D). The scores of 16 immune cells (A,C) and 13 immune-related functions (B,D) are displayed in boxplots. CCR, cytokine–cytokine receptor. Adjusted p values were shown as ns, not significant; *, p < 0.05; **, p < 0.01; and ***, p < 0.001.

