
FIGURE 1.
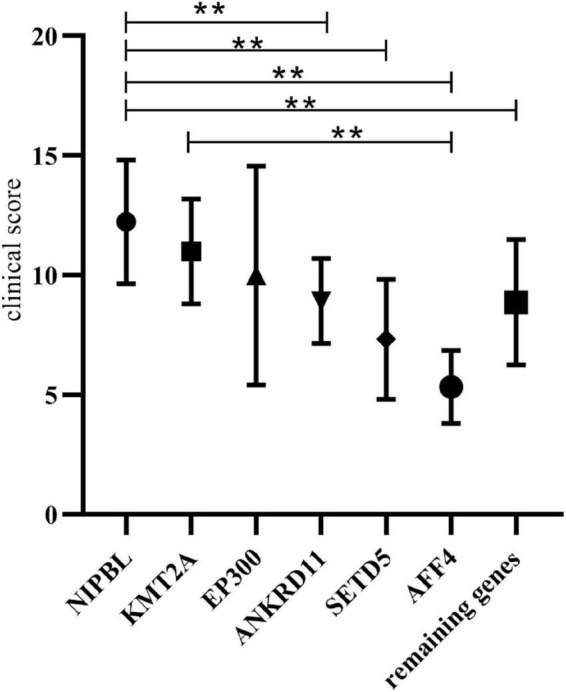
Clinical score comparison of the non-cohesion cohort and NIPBL cohort. **Indicates that the average clinical score of the two groups were statistically significant (p < 0.05).
Official websites use .gov
A
.gov website belongs to an official
government organization in the United States.
Secure .gov websites use HTTPS
A lock (
) or https:// means you've safely
connected to the .gov website. Share sensitive
information only on official, secure websites.
Clinical score comparison of the non-cohesion cohort and NIPBL cohort. **Indicates that the average clinical score of the two groups were statistically significant (p < 0.05).