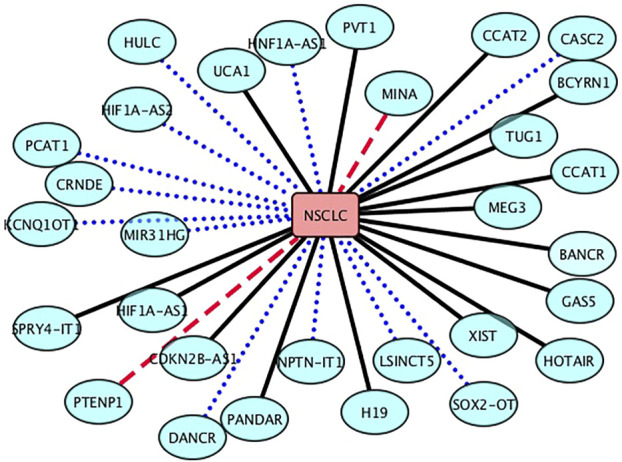
FIGURE 3.

Associations between the inferred top 30 lncRNAs and NSCLC. Black solid lines represent known LDAs in the lncRNADisease database. Blue-dot lines represent LDAs that can be observed in the MNDR database. Red-dash lines represent LDAs predicted to be potential lncRNA biomarkers of LN.
