Figure 12.

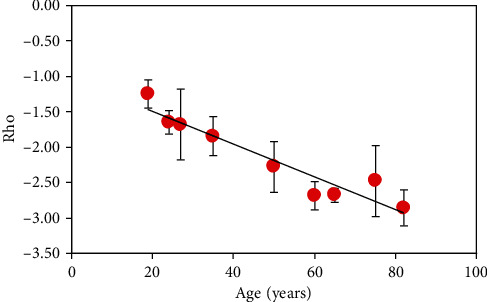
Relationship between ρ and age (ρ = –0.02,·age–1.03). Each symbol indicates the mean value for each specimen. Error bars indicate the standard deviation.

Relationship between ρ and age (ρ = –0.02,·age–1.03). Each symbol indicates the mean value for each specimen. Error bars indicate the standard deviation.