
Figure 5.
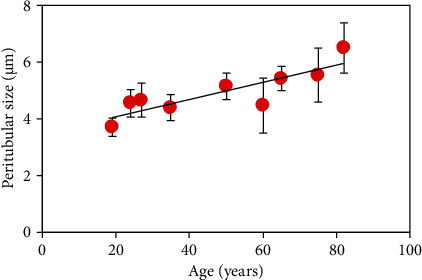
Relationship between age and peritubular width. Each symbol corresponds to the mean value for the corresponding specimens across all imaged dentinal areas. Error bars indicate the standard deviation. Black line represents the best linear fit to the data (size = 0.03∗age + 3.47).