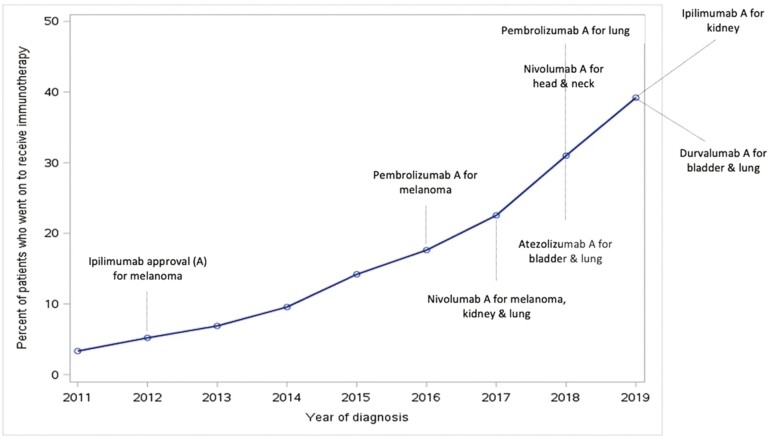
Figure 2.
Immunotherapy use in Ontario. X axis: time/year of diagnosis. Y axis: percentage of patients diagnosed with any of the cancer site of interest at a certain year who received immunotherapy out of the total number of patients diagnosed with any of the cancer site of interest during the same year.

