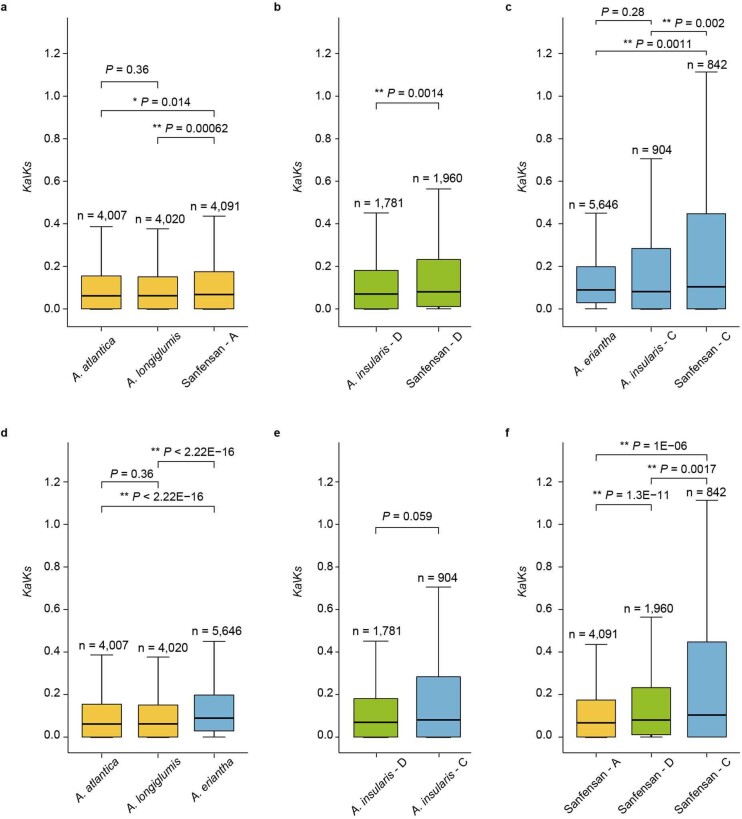
Extended Data Fig. 9. Comparison of the Ka/Ks distributions between the subgenomes of hexaploid ‘Sanfensan’ and tetraploid A. insularis, and the putative diploid A-genome (A. longiglumis, A. atlantica) and C-genome (A. eriantha) progenitors.
All estimates with Ks < 0.01 were excluded from the analysis. The central line for each box plot indicates the median. The top and bottom edges of the box indicate the first and third quartiles and the whiskers extend 1.5 times the interquartile range beyond the edges of the box. Numbers of samples used in each assay are indicated as n. The significance of the differences in the values between genomes (subgenomes) was estimated using the two-tailed Wilcoxon rank-sum test (*, P < 0.05, **, P < 0.01).

