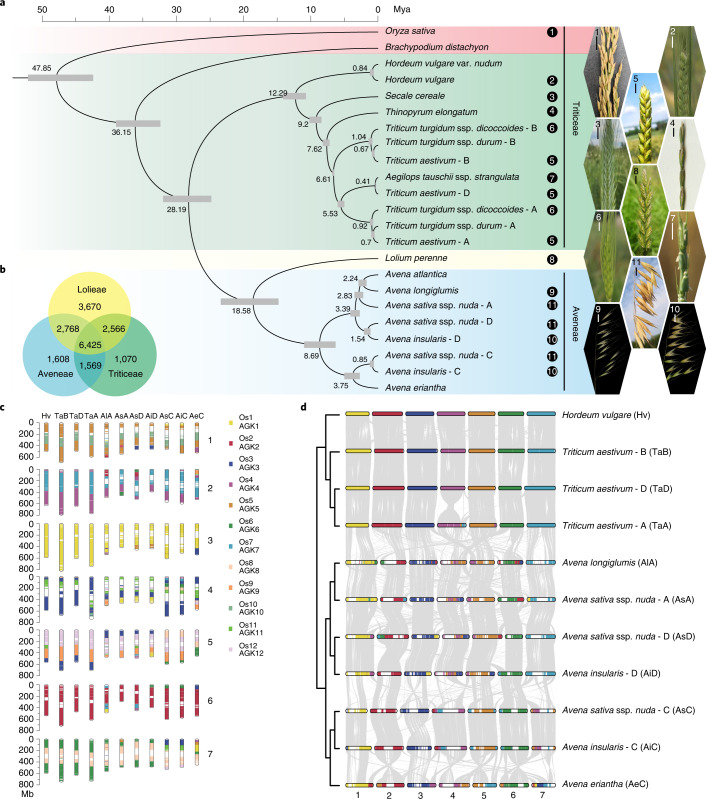
Fig. 2. Phylogenomic relationships of cereal crops.
a, Phylogeny and time scale of 23 subgenomes from 16 cereal crops and related grass species, including panicle images of the 11 sampled cereal crops. The number in the upper left corner of each panicle image corresponds to the number following the species name in the phylogenetic tree. Scale bars, 1 cm. b, Venn diagram showing the numbers of shared and unique gene families in the tribes of Aveneae, Lolieae and Triticeae. c, Probable chromosome evolutionary scenario of oat and wheat species. The subgenome chromosomes (1–7) are presented with a color code to show different segments from the 12 chromosomes of rice (Os1–Os12), which can be used as the representative of the ancestral grass chromosomes (AGK1–AGK12). The abbreviations in the top of the subgenomes are accordance with the abbreviations indicated in the brackets of panel d. d, Chromosome evolution based on barely genomes and chromosomal synteny between the three subgenomes of oat and wheat.

