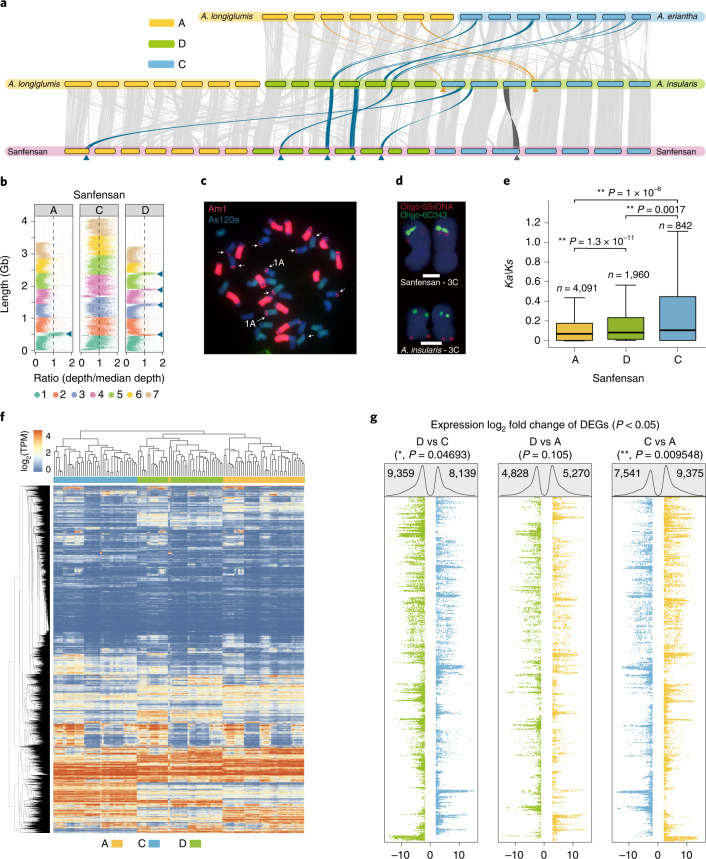
Fig. 4. Subgenome evolution in Avena species.
a, Synteny between the subgenomes of hexaploid oat and the putative tetraploid and diploid ancestors. The yellow and blue arrows and lines connecting the chromosomes represent the observed large chromosomal translocations (>40 Mb) from the A and C genomes, respectively. The dark gray arrow and line indicate the inversion in chromosome 3C between A. insularis and Sanfensan. b, Large C-to-A or C-to-D translocations are supported by mapping reads from the C genome diploid to the hexaploid reference genome; blue arrows indicate C-to-D and C-to-A intergenomic translocations. c, FISH using the C genome-specific repeat as a probe confirms the C-to-A and C-to-D translocations. Fluorescence signals from the A genome-specific repeat (As120a) are shown in green, and signals from the C genome-specific repeat (Am1) are in red. The white arrows indicate C-to-D and C-to-A intergenomic translocations. d, FISH confirms the inversion on chromosome 3C observed in the hexaploid oat genome. Oligo-5SrDNA (red) and Oligo-6C343 (green) gave clear hybridization signals on the short and long arms of the tetraploid 3C, respectively, whereas both signals are observed on the long arm of chromosome 3C in the hexaploid. For karyotyping in panels c and d, at least three slides for each accession and ten chromosomes per slide were examined. Scale bars, 2 μm. e, Comparison of Ka/Ks value distributions between the three subgenomes of hexaploid oat. The central line for each box plot indicates the median. The top and bottom edges of the box indicate the first and third quartiles and the whiskers extend 1.5 times the interquartile range beyond the edges of the box. Numbers of samples used in each assay are indicated as n. The asterisks represent significant differences (two-tailed Wilcoxon rank-sum test, **P < 0.01). f, Two-dimensional hierarchical cluster analysis of gene expression among single-copy homoeologous oat genes compared with organ-specific gene expression. TPM, transcripts per million. g, Analysis of log2-fold changes in pairwise gene expression between homoeologous genes showed biased expressions. DEGs, differentially expressed genes. Dot plots show the fold changes for each triplet ordered as shown in the y axis (f). The numbers of significantly differentially expressed triplets (one-tailed Fisher’s exact test, P < 0.05) across all organs are shown at the top of the box, and the significance of the differences in the values between subgenomes was estimated using the one-tailed Wilcoxon rank-sum test (*P < 0.05, **P < 0.01).

