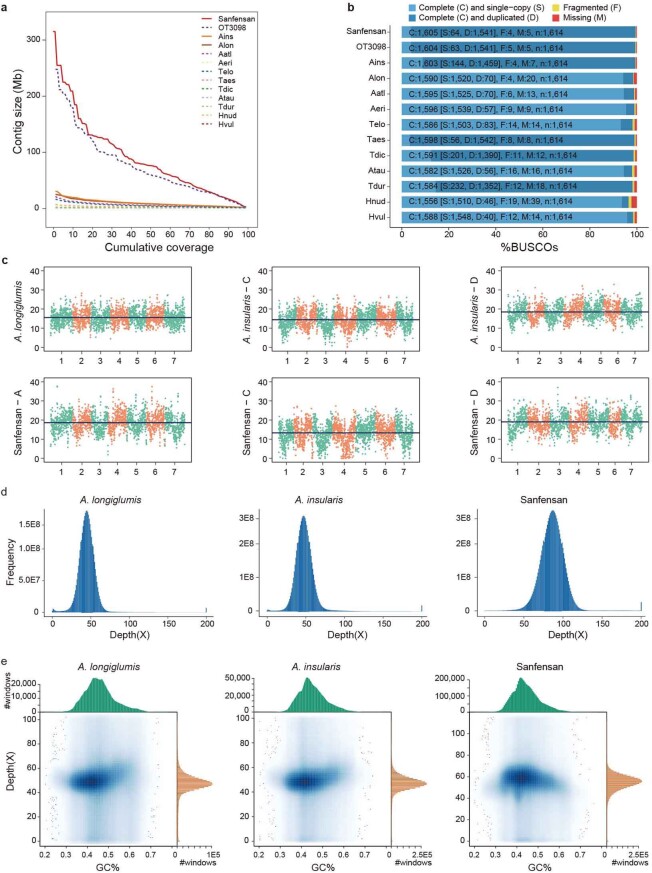
Extended Data Fig. 2. Genome assembly quality assessment.
a, NG-graph of the three assembled genomes and other related cereal crop species including A. sativa ssp. nuda cv. ‘Sanfensan’ (Sanfensan), A. sativa cv. ‘OT3098’ (OT3098), A. insularis (Ains), A. longiglumis (Alon), A. atlantica (Aatl), A. eriantha (Aeri), Th. elongatum (Telo), T. aestivum (Taes), T. turgidum ssp. dococcoides (Tdic), Ae. tauschii (Atau), T. turgidum ssp. durum (Tdur), H. vulgare ssp. nudum (Hnud), and H. vulgare cv. ‘Morex’ (Hvul). The NG contig length is calculated at integer thresholds (1% to 100%) and the contig size (in bp) for that particular threshold is shown on the y-axis. b, Completeness of the three assembled oat genomes and the related cereal crop species (as indicated in panel a), assessed using BUSCO. Bar charts show the percentages of 1,614 highly conserved plant BUSCO genes that are completely present (light and dark blue), fragmented (yellow), or missing (red) in each assemblies. c, The long terminal repeat (LTR) assembly index (LAI) scores of the three assembled Avena genomes. The x-axes show the seven chromosomes in each genome. The LAI scores, represented by dots, were calculated using 3 Mb-sliding windows with 1.5 Mb steps. The dark-blue lines indicate the average LAI score across each whole genome. d, The distribution of the average depth per million base pairs covered by the ONT reads. e, GC content distributions of the three assembled oat genomes. The GC content was determined using 2 kb nonoverlapping sliding windows.

