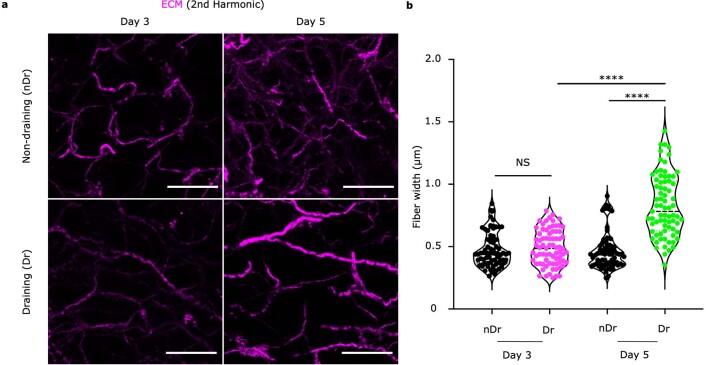
Extended Data Fig. 2. Analysis of ECM structures at Day 3 and Day 5 post-immunization.
a) 2nd Harmonic (magenta) signals visualize the ECM network in vibratome sections of lymph nodes. Scale bar, 15 μm. b) Quantification of ECM fiber thickness between day 3 and day 5 samples. Violin indicates plot indicates median and minimum/maximum. One-way ANOVA with Tukey’s multiple comparisons, ****p = 1.00E^−6. n = 75 individual fiber ROI for all groups from 3 independent LNs. This figure supports Fig. 3.

