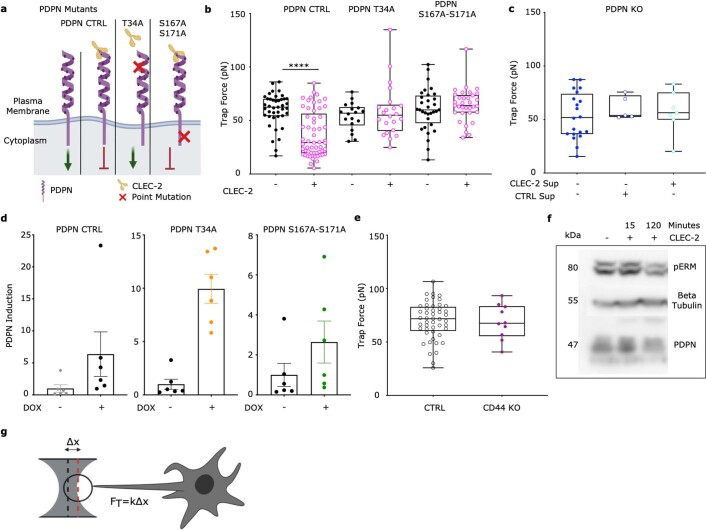
Extended Data Fig. 4. Induction of PDPN mutants in PDPN KO fibroblastic reticular cell line.
a) Schema of exogenous PDPN mutants and interaction with CLEC-2. Green arrow denotes active signaling by PDPN leading to actomyosin contractility, red arrow indicates inhibition of PDPN signaling and reduction in actomyosin contractility. b) Trap force measurements of FRCs expressing PDPN mutants after pre-treatment of CLEC-2. Box plot indicates median, interquartile range and minimum/maximum. One-way ANOVA with Tukey’s multiple comparisons, ****p = 1.00E^−6. n = individual cells where CLEC-2- PDPN CTRL (n = 41), CLEC-2+ PDPN CTRL (n = 57), CLEC-2- T34A (n = 18), CLEC-2+ T34A (n = 22), CLEC-2- S167A-S171A (n = 32), CLEC-2+ S167A-S171A (n = 33) analyzed over 5 independent experiments. c) Trap force measurements of PDPN CRISPR KO FRCs treated with CTRL or CLEC-2 supernatant. Box plot indicates median, interquartile range and minimum/maximum. One-way ANOVA with Tukey’s multiple comparisons. n = individual cells where PDPN KO (n = 20), CTRL SUP+ PDPN KO (n = 5), CLEC-2+ SUP PDPN KO (n = 7) over 2 independent experiments. d) Fold induction of exogenous PDPN, based on PDPN staining geometric mean, for each PDPN mutant cell line treated with or without doxycycline. PDPN CTRL (left), PDPN T34A (middle) and PDPN DSS (right). Mean ±SD error bars, N = 6. e) Trap force measurements of CTRL and CD44 (purple) KO FRCs. Box plot indicates median, interquartile range and minimum/maximum. Mann–Whitney test (two-tailed). n = individual cells where CTRL (n = 48) and CD44 KO (n = 10). f) Representative immunoblot of pERM in CTRL FRCs after treatment with CLEC-2. n = 2 independent experiments. g) Schema and equation to calculate trap force (Ft) from displacement. This figure supports Fig. 4.

