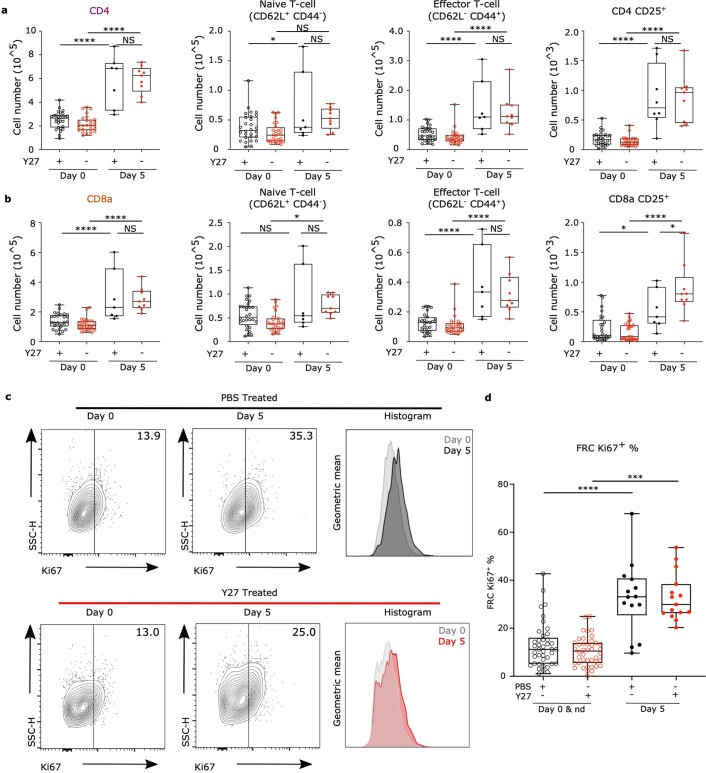
Extended Data Fig. 9. Flow cytometry gating strategy and Ki67 measurements.
a-b) CD3+ CD4+ and CD3+ CD8+ subpopulation cell numbers + /- ROCK inhibition (Y27632). Box plot indicates median, interquartile range and minimum/maximum. One-way ANOVA with Tukey’s multiple comparisons, ****p = 1.00E^−6, *p = 0.0387, 0.0117, 0.0201, 0.0226. n = individual LNs where Day 0 (n = 28), Day 0Y27 (n = 28), Day 5 (n = 7), Day 5Y27(n = 9) over 2 independent experiments. c) Example of Ki67+ FRCs cell plots and histogram of Ki67 geometric mean, comparing immunization and Y27 treatments. d) Quantification of Ki67+ FRCs. Box plot indicates median, interquartile range and minimum/maximum. One-way ANOVA with Tukey’s multiple comparisons. ****p = 1.00E^−6, ***p = 1.00E^−5. n = individual LNs where Day 0 (n = 28), Day 0Y27 (n = 29), Day 5 (n = 14), Day 5Y27(n = 15) over 5 independent experiments. This figure supports Fig. 8.

