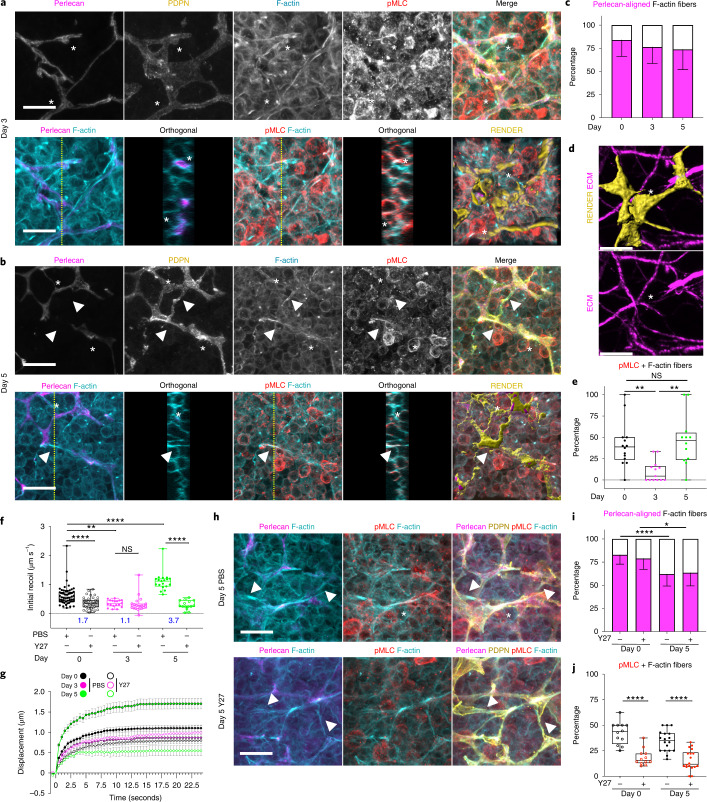
Fig. 3. Actomyosin contractility sets FRC network tension in response to tissue expansion.
a,b, Actomyosin structure in FRCs day 3 (a) and day 5 (b) after IFA/OVA immunization for perlecan (matrix, magenta), PDPN (FRC, yellow), phalloidin (F-actin, cyan), and pMLC (red). Asterisks and arrowheads indicate F-actin cables with or without perlecan alignment. Orthogonal views (yellow dotted line, yz axis, 10 μm depth). Representative image of three independent experiments. Scale bars, 10 µm. c, Percentage of Fibers. Stacked bar plots with mean ± standard deviation (s.d.) error bars. d, Confetti-labeled FRCs (yellow) spanning space without (white asterisk) ECM (magenta). Scale bar, 5 µm. e, Percentage of Fibers. Box plot indicates median, interquartile range, and minimum/maximum. One-way ANOVA with Tukey’s multiple comparisons, **P < 0.01. c,e, n indicates image ROI on day 0 (n = 14), day 3 (n = 13), and day 5 (n = 12) from three mice. f, Initial recoil velocity (µm s−1) after IFA/OVA immunization, ± ROCK inhibition (Y27632). Resistive myosin forces (blue text indicates the ratio between PBS/Y27). Box plot indicates median, interquartile range, and minimum/maximum. Two-way ANOVA with Tukey’s multiple comparisons, ****P < 0.0001, **P = 0.001973. g, Recoil curves of network displacement (µm) (mean ± s.e.m.). f,g, n indicates an ablation on day 0 (n = 54), day 0 + Y27 (n = 43), day 3 (n = 18), day 3 + Y27 (n = 20), day 5 (n = 19), and day 5 + Y27 (n = 15) over three independent experiments. h, Actomyosin structure in FRCs day 5 after IFA/OVA immunization with or without ROCK inhibition (Y27632). Perlecan (matrix, magenta), PDPN (FRC, yellow), phalloidin (F-actin, cyan), and pMLC (red). Asterisks and arrowheads indicate F-actin cables with or without perlecan alignment. Representative image of three independent experiments. Scale bars, 10 µm. i, Percentage of Fibers. Stacked bar plots with mean ± s.d. error bars. Two-way ANOVA with Tukey’s multiple comparisons, ****P = 0.000577, *P = 0.03824. j, Percentage of Fibers. Box plot indicates median, interquartile range, and minimum/maximum. One-way ANOVA with Tukey’s multiple comparisons, ****P < 0.0001. i,j, n indicates image ROI on day 0 (n = 12), day 0 + Y27 (n = 12), day 5 (n = 18), and day 5 + Y27 (n = 18) from three mice. NS, not significant.

