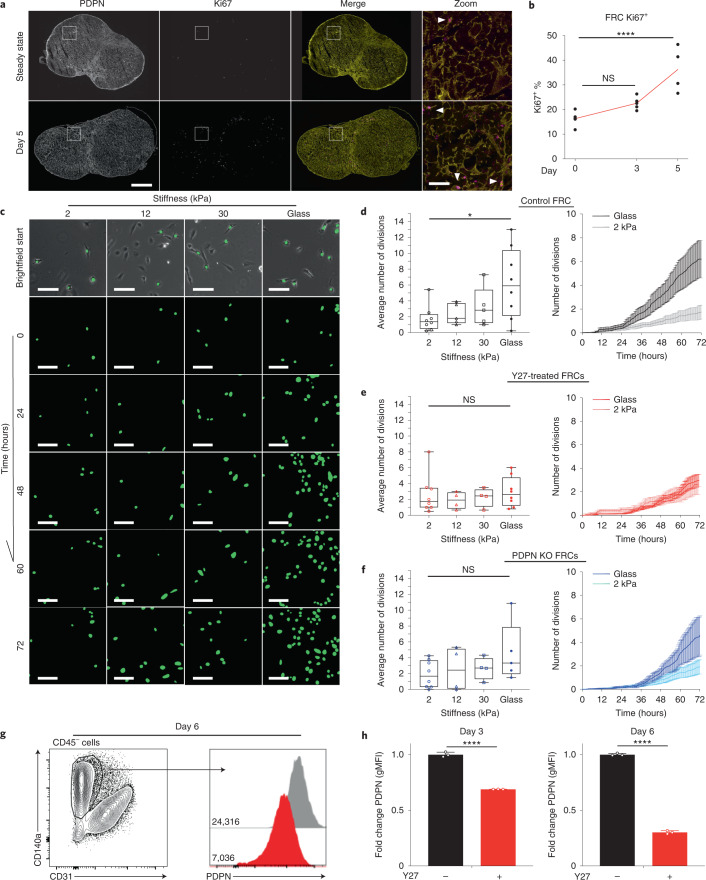
Fig. 5. FRCs are mechanically sensitive in vitro.
a, LN tile scan of PDPN+ (yellow) and Ki67+ (magenta) cells. Scale bars, 500 µm (zoom-in T cell area (white box), 50 µm). Arrowheads mark PDPN+ Ki67+ FRCs. b, Flow cytometric analysis of Ki67+ percentage of FRCs after IFA/OVA immunization. Two-way ANOVA with Dunnett’s test, ****P = 1.00 × 10⁻⁶. n indicates LNs on day 0 (n = 5), day 3 (n = 5), and day 5 (n = 4). c, FRC GFP nuclei are tracked over 72 h on different polyacrylamide gel stiffnesses. Scale bar, 50 µm. d–f, Average number of divisions per cell in 72 h and over time on different substrate rigidities. d, Control FRCs. e, FRCs treated with ROCK inhibition (Y27632). f, PDPN KO FRCs. Box plot indicates median, interquartile range, and minimum/maximum. One-way ANOVA with Tukey’s multiple comparisons, *P = 0.0298. n indicates image ROI for 2 kPa (n = 8), 12 kPa (n ≥ 4), 30 kPa (n ≥ 4), and glass (n ≥ 5) over three independent experiments. Division curves compare glass and 2 kPa (mean ± s.e.m.). g, Flow gating and PDPN histograms geometric mean fluorescent intensity (gMFI) of isolated primary FRCs after ROCK inhibition (Y27632). h, Fold change in gMFI of PDPN on FRCs following ROCK inhibition (Y27632). Mann–Whitney test (two tailed), ****P < 0.0001. n = 3 LNs.

