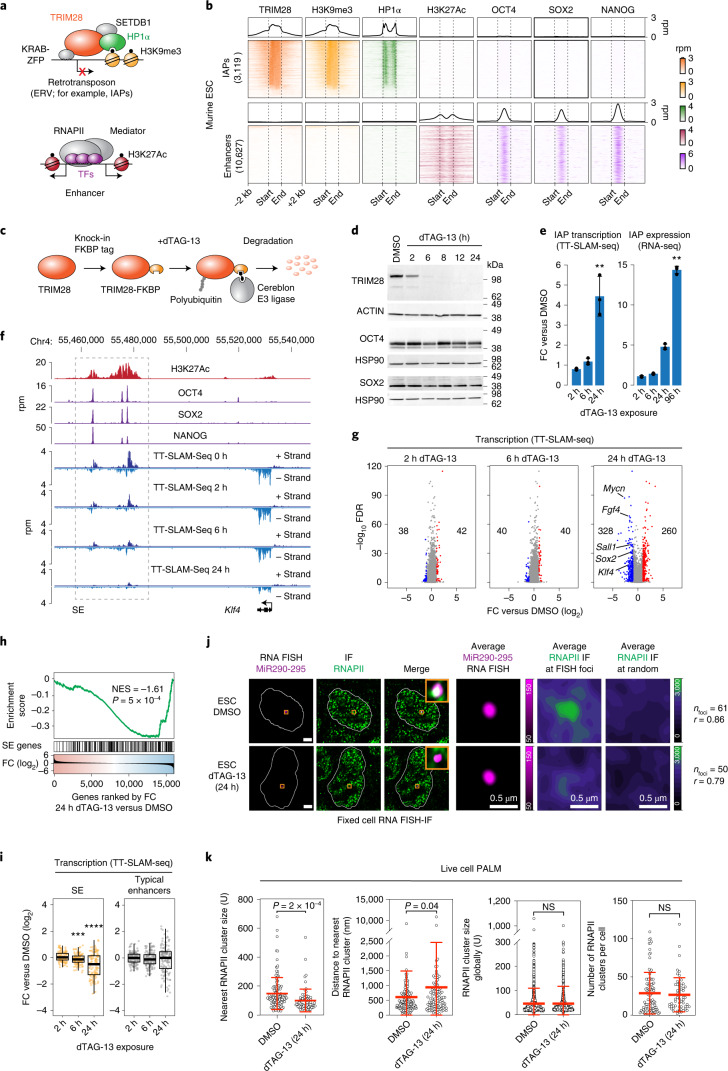
Fig. 1. TRIM28 degradation leads to the reduction of SE transcription and loss of transcriptional condensates at SEs in mESCs.
a, Models of the TRIM28/HP1α pathway and enhancers. b, Heatmap of ChIP–seq read densities within a 2-kb window around full-length IAP ERVs and enhancers in mESC. The genomic elements were length normalized. Enhancers include the constituent enhancers of SEs and typical enhancers. Rpm, reads per million. c, Scheme of the dTAG system to degrade TRIM28 in mESCs. d, Western blot validation of the FKBP degron tag and its ability to degrade TRIM28. e, FC in read density of TT-SLAM-seq and RNA-seq data after the indicated duration of dTAG-13 treatment, normalized to the level in the DMSO control. Data are presented as mean values ± s.d. from three biological replicates. P values are from unpaired two-sided t-tests. **P < 0.01. f, Genome browser tracks of ChIP–seq data (H3K27Ac, OCT4, SOX2, NANOG) in control mESCs and TT-SLAM-seq data upon 0 h, 2 h, 6 h and 24 h dTAG-13 treatment at the Klf4 locus. Chr, chromosome. g, FC of gene transcription (TT-SLAM-seq data) upon dTAG-13 treatment. The number of significantly deregulated genes (DESeq2) and example pluripotency genes are highlighted. h, Gene set enrichment analysis: genes are ranked according to their FC in transcription (TT-SLAM-seq) after 24 h of dTAG-13 treatment. SE genes are marked with black ticks. P denotes a nominal P value. i, Log2 FC in TT-SLAM-seq read density at SEs and typical enhancers upon dTAG-13 treatment normalized to untreated control mESCs. P values are from two-sided Wilcoxon–Mann–Whitney tests. ****P = 5 × 10⁻⁸, ***P = 5 × 10⁻⁴. j, Representative images of individual z-slices (same z) of RNA-FISH and IF signal, and an image of the merged channels. The nuclear periphery determined by DAPI staining is highlighted as a white contour (scale bars, 2.5 μm). Also shown are averaged signals of either RNA-FISH or RNAPII IF centered on the FISH foci or randomly selected nuclear positions (scale bars, 0.5 μm). r denotes a Spearman’s correlation coefficient. k, Live-cell PALM imaging of Dendra2-RNAPII and nascent RNA transcripts of Sox2-MS2 in mESCs after 24 h dTAG-13 treatment. Left, size of the nearest RNAPII cluster around Sox2; middle left, distance between the Sox2 locus and the nearest RNAPII cluster; middle right, average RNAPII cluster size globally; right, number of RNAPII clusters per cell. Data are presented as mean values ± s.d. P values are from Wilcoxon–Mann–Whitney tests.

