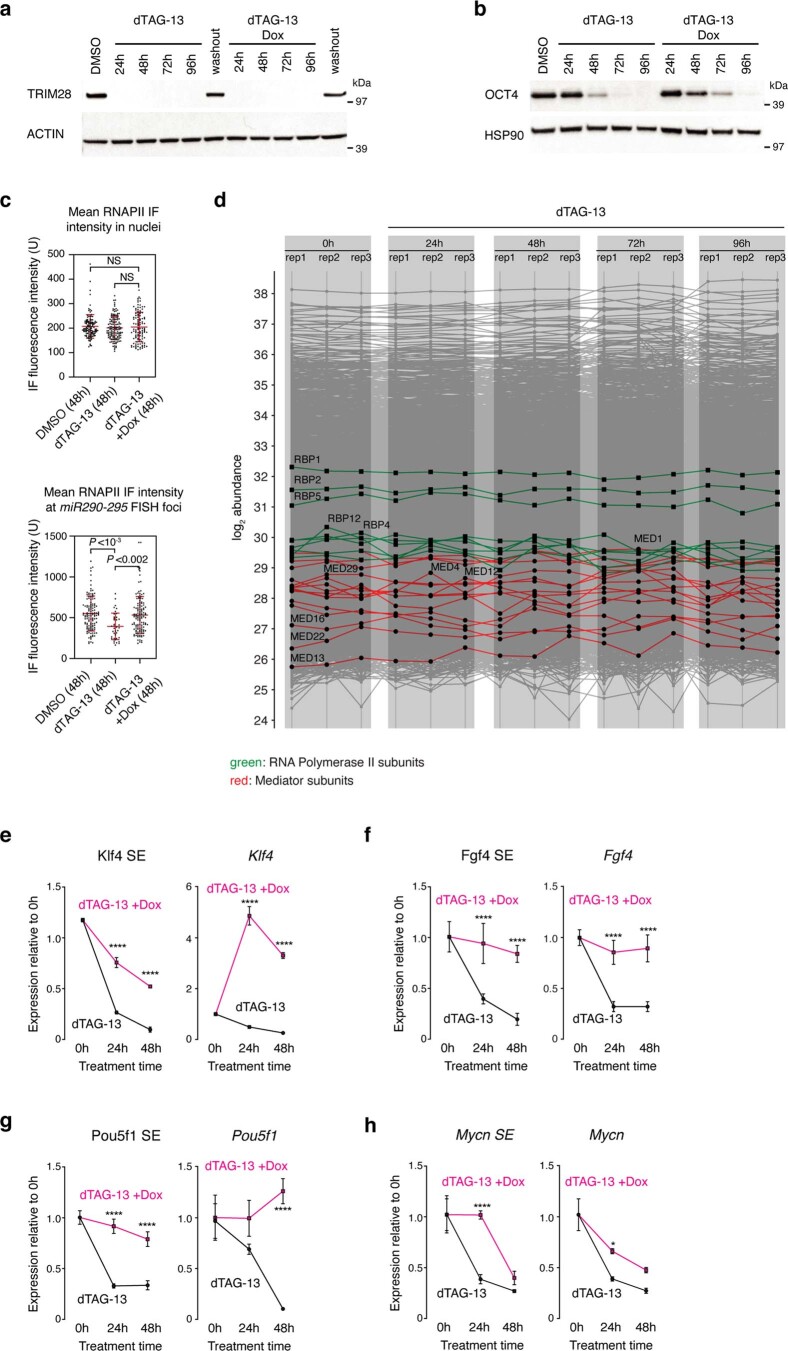
Extended Data Fig. 5. Additional characterization of the OSKM/dTAG-13 experiments.
a. Western blot validation of the FKBP degron tag and its ability to degrade TRIM28 in iPSCs. Washout of the dTAG-13 ligand (24 h) indicates reversibility of degradation. Western blot experiments were performed twice and one representative image is shown. Actin is shown as the loading control. b. Western blot validation of the OSKM ectopic expression in the iPSC line. Western blot experiments were performed three times and one representative image is shown. HSP90 is shown as the loading control. c. dTAG-13 treatment leads to reduced RNAPII immunofluorescence signal at miR290-295 FISH foci which is rescued by OSKM ectopic expression, while overall RNAPII levels do not change. (top) Quantification of RNAPII mean fluorescence intensity (n = 117 for DMSO, n = 138 for dTAG-13, n = 110 for Dox+dTAG-13) in the cells used in Fig. 3f. (bottom) Quantification of RNAPII IF intensities at the miR290-295 FISH foci (n = 128 for DMSO, n = 39 for dTAG-13, n = 89 for Dox+dTAG-13) detected in the cells used in Fig. 3f. Data are presented as mean values ± SD from one staining experiment. P value is from a two-sided Mann-Whitney test. d. Mass spectrometry-detected protein abundance for three individual replicate samples after 0 h, 24 h, 48 h, 72 h and 96 h dTAG-13 treatment of mESCs. RNAPII subunits are highlighted in green. Mediator complex subunits are highlighted in red. e–h. qRT-PCR data normalized to the 0 h of dTAG-13 treatment. Data are from three independent biological replicates (that is, three wells on a tissue culture plate) and are presented as mean values ± SD. The experiment was repeated three times, and data from one representative experiment are shown. P values are from two-tailed t-tests. *: P < 0.05, ***: P < 10−3, ****: P < 10−4.

