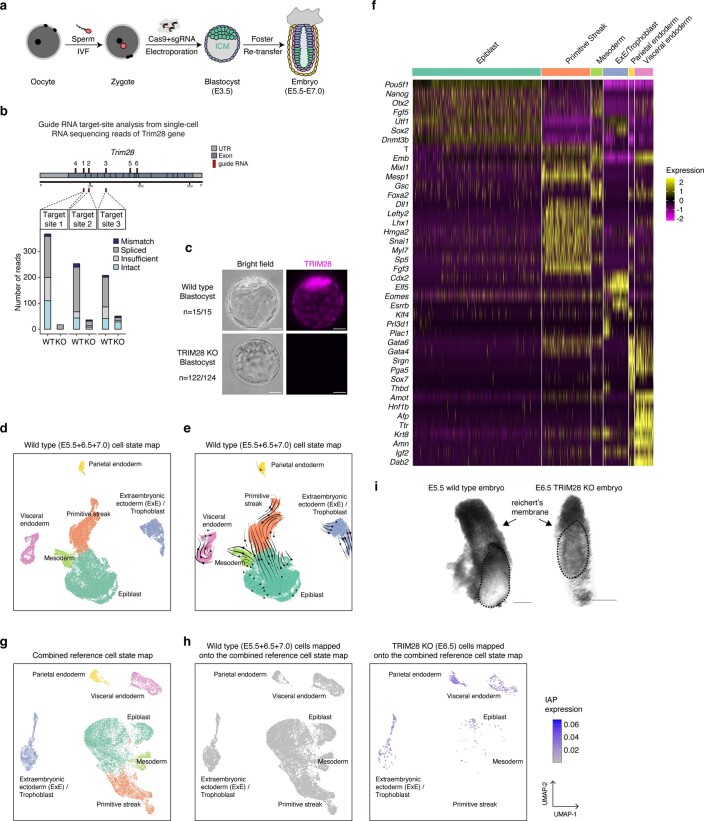
Extended Data Fig. 10. Reference cell state maps in early mouse embryos.
a. Scheme of the zygotic CRISPR/Cas9 – scRNA-seq platform. b. Cut site analysis. The number, type and distribution of reads mapping to the sites targeted with the TRIM28 guide RNAs is quantified in the scRNA-seq data. c. Immunofluorescence verification of TRIM28 KO. Representative images are shown, with the number of embryos where the immunofluorescence confirmed the genotype per the total number of embryos analyzed. The knockout experiment was performed five times independently, and the pool of embryos from all experiments were used for staining. Scale bars: 20 μm. d. UMAP of wild type early mouse embryos spanning E5.5-E7.0 developmental window. The wild type cells used in scRNA-seq experiments from E5.5, E6.5 and E7.0 developmental stages were included. e. RNA velocity map of wild type early mouse embryos spanning E5.5-E7.0 developmental window. f. Heatmap representation of the expression levels of marker genes of each cluster/cell state. g. Combined cell state map. The wild type cells and TRIM28 KO cells used in scRNA-seq experiments were included. h. Elevated IAP expression in TRIM28 KO cells. (left) Wild type cells used in scRNA-seq experiments from E5.5, E6.5 and E7.0 developmental stages are projected on the combined reference map and are colored according to the IAP expression of the corresponding embryo and cell state. (right) TRIM28 KO E6.5 cells are projected on the combined reference map and are colored according to IAP expression of the corresponding embryo and cell state. i. Bright-field images of representative embryos from E5.5 wild type and E6.5 TRIM28 KO. Dotted lines represent the embryo that was dissected out from the dense Reichert’s membrane. Scale bar is 100 µm.

