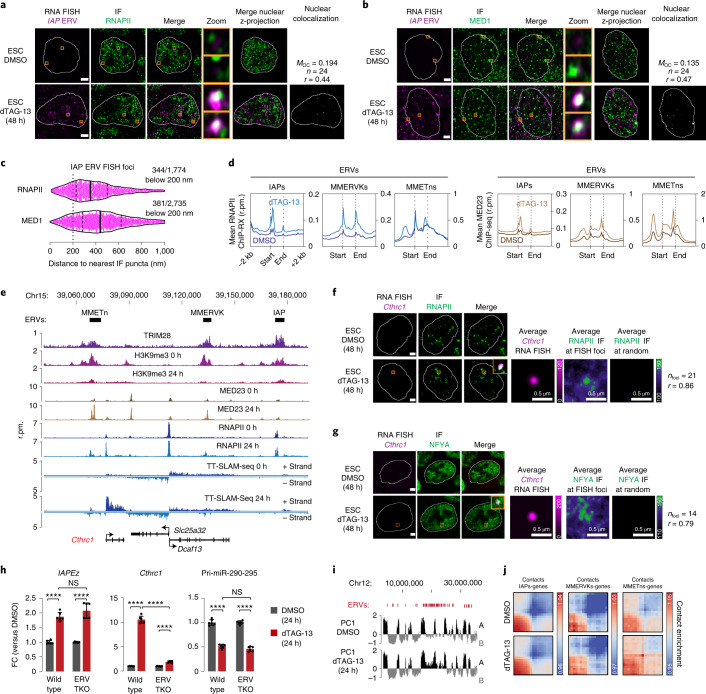
Fig. 2. Derepressed IAPs form nuclear foci that associate with RNAPII condensates and incorporate nearby genes.
a, Representative images of individual z-slices (same z) of RNA-FISH and RNAPII IF signal, and an image of the merged channels. The nuclear periphery determined by DAPI staining is highlighted as a white contour. The zoom column displays the region of the images highlighted in a yellow box (enlarged for greater detail). Merge of the nuclear z-projections is displayed, and overlapping pixels between the RNA-FISH and IF channels are highlighted in white. Displayed MOC and Pearson’s correlation coefficient (r) values are an average obtained from 24 analyzed nuclei. Scale bars, 2.5 μm. b, Same as a, except with MED1 IF. c, Distance of IAP RNA-FISH foci to the nearest RNAPII or MED1 IF puncta. Each dot represents one IAP RNA-FISH focus. d, Meta representations of RNAPII ChIP with reference exogenous genome (ChIP-RX) (left) and MED23 ChIP–seq (right) read densities at IAP, MMERVK and MMETn ERVs in control (DMSO-) and dTAG-13 (24 h)-treated mESCs. The mean read densities are displayed ±2 kb around the indicated elements. The genomic elements were length normalized. e, Genome browser tracks at the Cthrc1 locus. Note the independent transcription initiation events at Cthrc1 and MMETn, ruling out that the MMETn acts as an alternative Cthrc1 promoter. Rpm, reads per million. f, Representative images of individual z-slices (same z) of RNA-FISH and IF signal, and an image of the merged channels. The nuclear periphery determined by DAPI staining is highlighted as a white contour (scale bars, 2.5 μm). Also shown are averaged signals of either RNA-FISH or IF centered on the Cthrc1 FISH foci or randomly selected nuclear positions (scale bars, 0.5 μm). r denotes a Spearman’s correlation coefficient. g, Same as f, except with NFYA IF. h, qRT–PCR data for IAP RNA, Cthrc1 mRNA and the Pri-miR-290-295 transcript in control and ERV-triple knockout (TKO) cells. Data are presented as mean values ± s.d. from six biological replicates. P values are from two-tailed t-tests. ****P < 1 × 10⁻⁴. i, Principal component (PC) plot of Hi-C interactions at an ERV-rich locus on chromosome 12. j, Pile-up analysis of contacts between IAPs, MMERVKs, MMETns and transcribed genes in wild-type and TRIM28-degraded mESCs.

