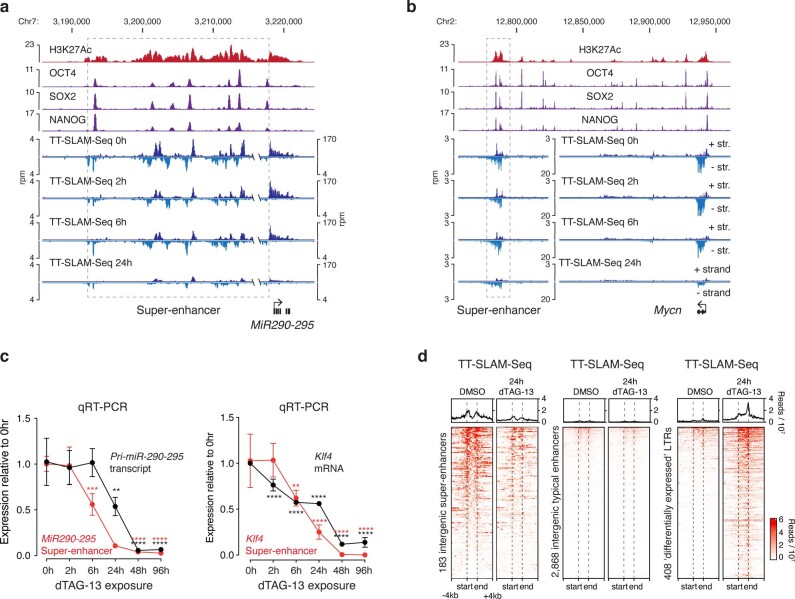
Extended Data Fig. 1. Reduction of super-enhancer transcription and the pluripotency circuit in TRIM28-degraded mESCs.
a. Acute reduction of transcription at the miR290-295 super-enhancer locus upon TRIM28-degradation. Displayed are genome browser tracks of ChIP-seq data (H3K27Ac, OCT4, SOX2, NANOG) in control mESCs, and TT-SLAM-seq data upon 0 h, 2 h, 6 h and 24 h dTAG-13 treatment at the miR290-295 locus. Rpm: reads per million. Co-ordinates are mm10 genome assembly co-ordinates. b. Acute reduction of transcription at the Mycn super-enhancer locus upon TRIM28-degradation. Displayed are genome browser tracks of ChIP-seq data (H3K27Ac, OCT4, SOX2, NANOG) in control mESCs, and TT-SLAM-seq data upon 0 h, 2 h, 6 h and 24 h dTAG-13 treatment at the Mycn locus. Rpm: reads per million. Co-ordinates are mm10 genome assembly co-ordinates. c. qRT-PCR validation of the TT-SLAM-seq data at the miR290-295 and Klf4 loci. Displayed are transcript levels after the indicated duration of dTAG-13 treatment. Values are displayed as mean ± SD from three independent experiments and are normalized to the level at 0 h. P values are from two-tailed t-tests. ****: P < 10−4, ***: P < 10−3, **: P < 10−2, *: P < 0.05. d. Visualization of nascent transcripts at super-enhancers, enhancers and de-repressed LTR retrotransposons. Displayed are TT-SLAM-seq read densities from both strands within 4 kb around the indicated sites. The genomic features (the middle part of the plot) were length normalized. Meta-analyses of the mean signals are displayed above the heatmaps.

