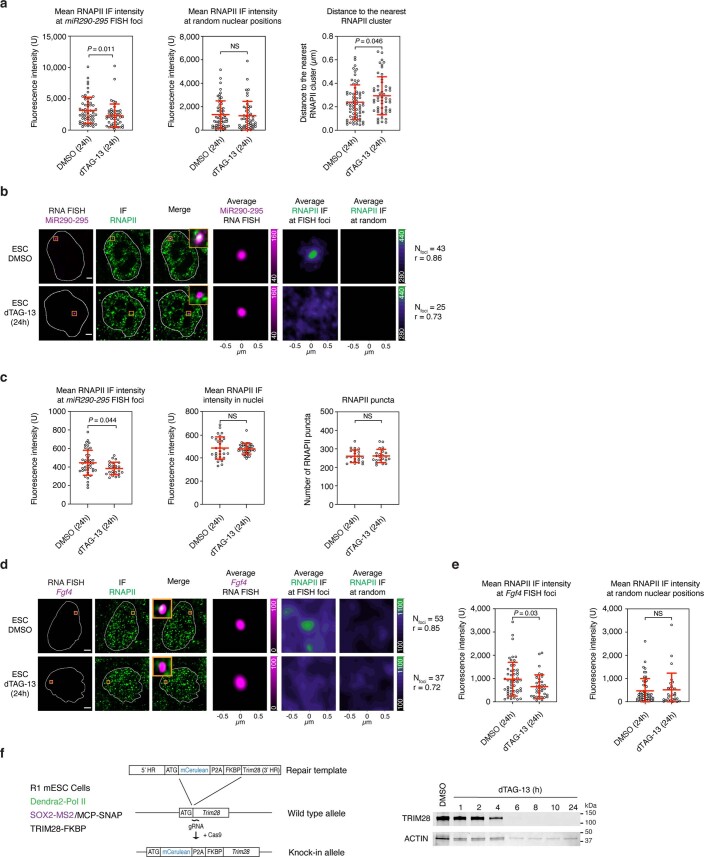
Extended Data Fig. 2. Loss of SE-association with RNAPII puncta at super-enhancers.
a. Analyses of cells used in Fig. 1j. (left) RNAPII IF intensity at the miR290-295 FISH foci (nDMSO = 61, ndTAG-13 = 50). (middle) RNAPII mean fluorescence intensity at random nuclear positions (nDMSO = 61, ndTAG-13 = 50). (right) Distance between the FISH focus and the nearest RNAPII puncta (nDMSO = 67, ndTAG-13 = 53). Data presented as mean values ± SD from one staining experiment. P values are from two-sided Mann-Whitney tests. NS: not significant. b. Images of RNA-FISH and IF signal. Nuclear periphery determined by DAPI staining is highlighted as a white contour. Also shown are averaged signal of either RNA FISH or RNAPII IF centered on the miR290-295 FISH foci or randomly selected nuclear positions. Data were collected as an independent replicate of experiments displayed in Fig. 1j. Scale bars: 2.5 μm. c. Analysis of cells used in panel ‘b’. (left) RNAPII IF intensity at the miR290-295 FISH foci (nDMSO = 43, ndTAG-13 = 25). (center) RNAPII mean fluorescence intensity (nDMSO = 30, ndTAG-13 = 40). (right) Number of RNAPII puncta on a representative set of cells (nDMSO = 22, ndTAG-13 = 22). Data are presented as mean values ± SD from one staining experiment. P values are from two-sided Mann-Whitney tests. NS: not significant. d. Images of individual z-slices (same z) of the Fgf4 RNA-FISH and IF signal. Nuclear periphery determined by DAPI staining is highlighted as a white contour. Also shown are averaged signals of either RNA FISH or RNAPII IF centered on the FISH foci or randomly selected positions. Scale bars: 2.5 μm. e. Analyses of cells used in panel ‘d.’ (left) RNAPII IF intensity at the Fgf4 FISH foci (nDMSO = 53, ndTAG-13 = 37). (right) RNAPII mean fluorescence intensity at random nuclear positions (nDMSO = 53, ndTAG-13 = 29). Data presented as mean values ± SD from one staining experiment. P values are from two-sided Mann-Whitney tests. NS: not significant. f. (left) Scheme of FKBP knock-in strategy in the R1 mESCs used in the PALM experiments. (right) TRIM28 Western blot in the R1 mESCs. Western blot was done once.

