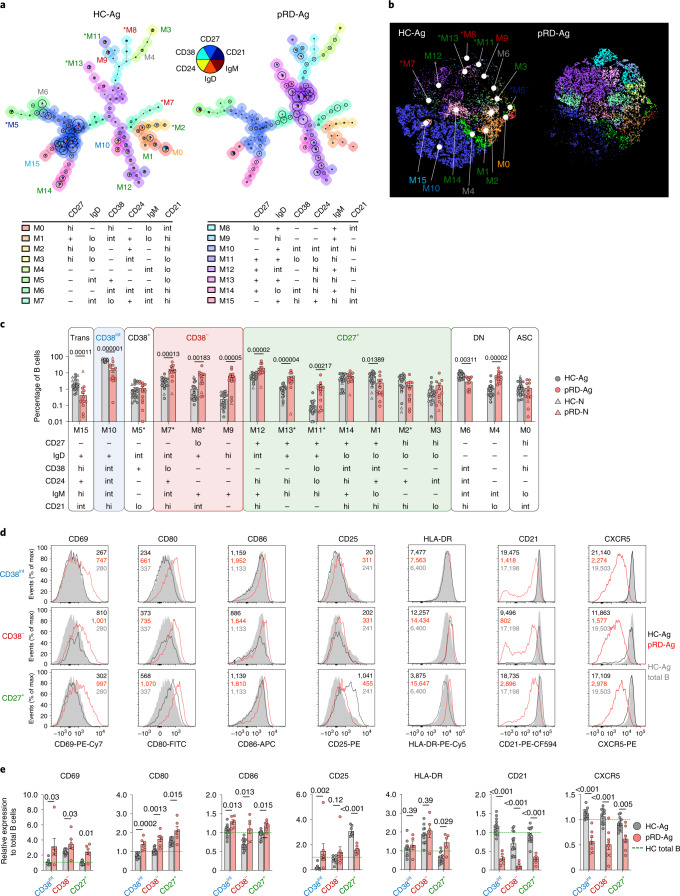
Fig. 1. Immunophenotyping of peripheral blood B cells.
a, Automated B cell subset identification by FlowSOM. Minimal spanning trees of a representative HC and a patient with pRD are shown. Metaclusters, corresponding to individual B cell subsets are indicated by the background color of the nodes, numbers (M0–15) and marker expression pattern. b, B cell subset composition. Metaclusters from concatenated live B cells of four HCs and four patients with pRD were projected onto t-SNE space and assigned as in a. c, Frequencies of the specific B cell subsets. Circles represent antigen-experienced donors, HCs (HC-Ag, n = 18) and patients with pRD (pRD-Ag, n = 13); triangles represent antigen-naive infant donors (HC-N, n = 4; pRD-N n = 1). Subsets comprising Trans, CD38int, CD38+, CD38−, CD27+, DN and ASC populations are depicted with different backgrounds. Statistical analyses were performed on individuals with antigens (HC-Ag versus pRD-Ag) (Mann–Whitney U-test with Holm–Šídák multiple comparison). Asterisks indicate new B cell subsets for a–c. d, Activation of peripheral blood B cells. Surface expression of CD69, CD25, HLA-DR, CD80, CD86, CD21 and CXCR5 in CD38int, CD38− and CD27+ B cells is shown as histograms. Filled gray histograms depict the expression of each marker on the total B cells from an HC. Dark gray and red lines represent the expressions of each marker in the indicated compartments (CD38int, CD38− or CD27+) from an HC and a patient with pRD, respectively. Geometric mean fluorescence intensities (gMFIs) are indicated for each HC (black) and pRD B cell subsets (red) and HC total B cells (gray). e, Expression of activation markers. gMFI of each marker from CD38int, CD38− and CD27+ compartments were normalized by donors to the gMFIs of the total B cells from the HC(s) used in each experiment. Data are shown as mean ± s.e.m. with individual values. Therefore, changes in the expression by compartments in HC-Ag (gray, n = 14) and patients with pRD-Ag (red, n = 6–8) are shown as relative to 1 (green dashed line), which represents marker expression level in the total B cells of HCs. Data were analyzed by Mann–Whitney U-test.

