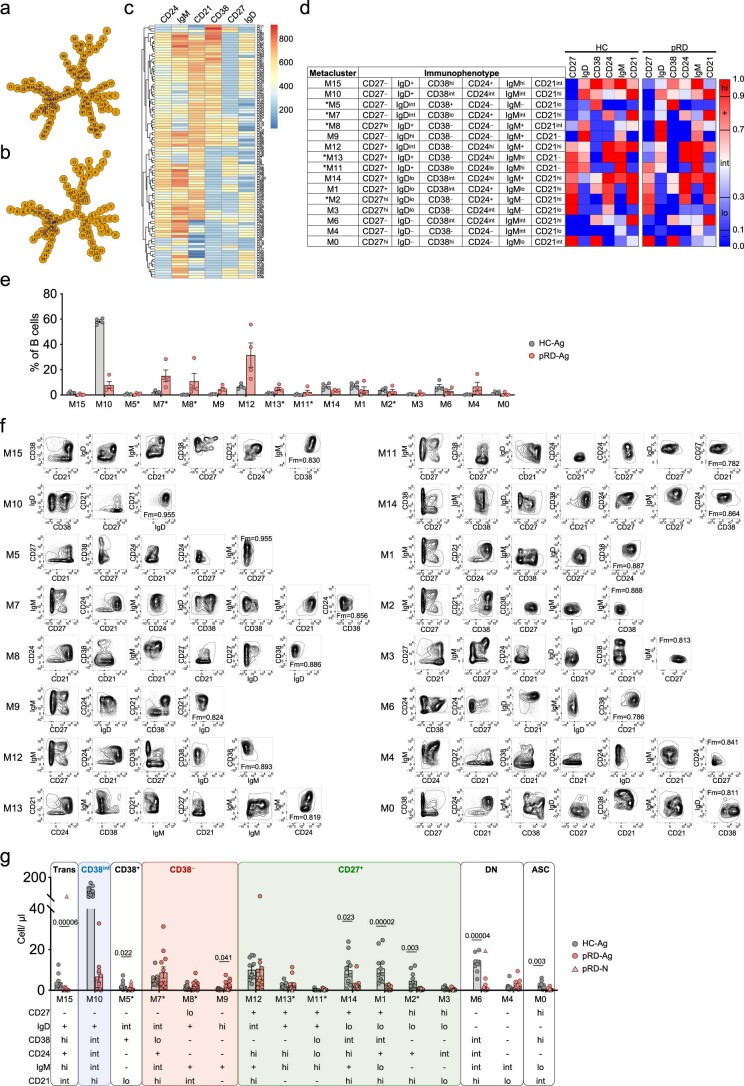
Extended Data Fig. 3. Automated unsupervised B cell subset identification by FlowSOM.
(a). Minimal spanning tree (MSP). MSPs were built as described in Methods to visualize similar nodes in branches and their relative connection to each other. Nodes are numbered as 1–100. (b). Metaclustering. Based on similarities, nodes were classified into 16 metaclusters (M0–15), each representing a unique B cell subset. (c). Relative expression of surface markers. Heat map represents the relative expression level of CD21, CD24, CD27, CD38, IgD and IgM on the B cells concatenated from four HC-Ags and four pRD-Ag patients by nodes. (d) B cell subset assignment. Metaclusters were assigned to B cell subsets as described in Methods. Novel subsets are depicted with asterisk. Subsets are organized according to possible developmental stages. Immunophenotypic definition of each subset is indicated. Heat map represents the normalized mean expression values of each surface markers for the HC-Ag (n = 4) and pRD-Ag patients (n = 4) separately corresponding to each metaclusters. Scale shows normalized value ranges for the expression of each marker defined as negative (−), low (lo), intermediate (int), positive (+) and high (hi). (e) Subset frequencies by FlowSOM. Frequencies of each metacluster from HC-Ags (n = 4) and pRD-Ag patients (n = 4) are shown as mean±s.e.m. with individual values. (f) Subset identification by HyperFinder. Two-dimensional sequential gating was constructed by HyperFinder FlowJo plugin using dual combinations of CD21, CD24, CD27, CD38, IgD and IgM parameters. Contour plots were generated on the data set concatenated from the four pRD-Ag patients and four age-appropriate HC-Ag. Fm-scores are inserted in the last plot of the sequential gating for each B cell subset. (g) Cell number of the specific B cell subsets. Data are shown as mean±s.e.m. with individual values from HC-Ag (n = 11), pRD-Ag (n = 11) and pRD-N (n = 1). Mann–Whitney U test with multiple comparison (Holm-Šídák method), P13 with lymphoproliferation was excluded from the analysis.

