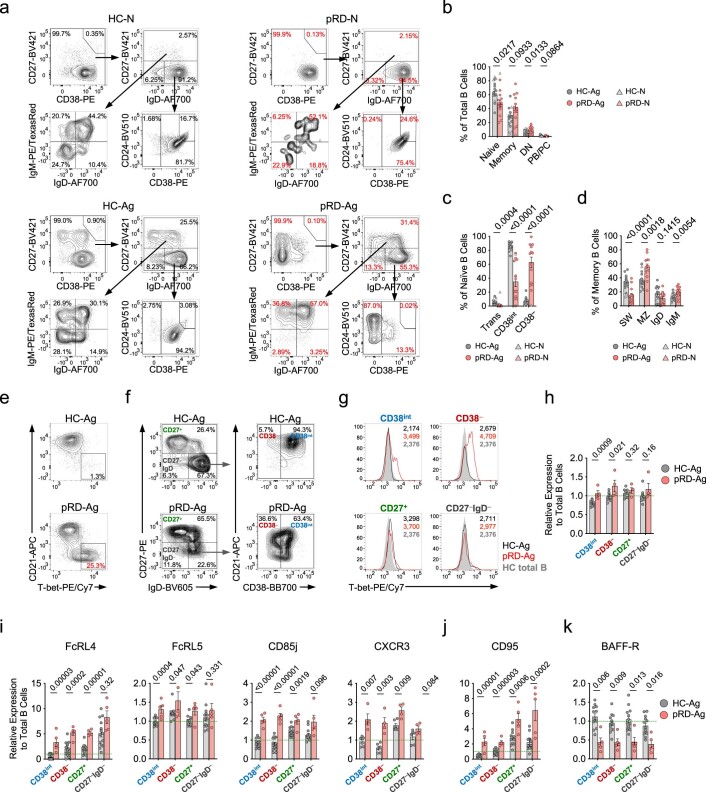
Extended Data Fig. 4. Extended B cell phenotyping.
(a) Fractioning B cells by conventional standard gating. Plots show a representative HC-Ag, HC-N, pRD-Ag and the pRD-N subjects. (b) Major B cell subset frequencies. Frequencies of naive (CD27−IgD+), memory (CD27+), DN (CD27−IgD−) and plasmablast/plasmacell (CD27hiCD38hi) B cell populations are shown. (c) Transitional, CD38int and CD38− subsets frequencies from CD27−IgD+ gate. (d) Memory B cell subsets frequencies from CD27+ gate. For h-j statistical analyses were performed on Ag subjects (HC-Ag vs pRD-Ag) using Mann–Whitney U test with multiple comparison (Holm-Šídák method). Bars represent mean±s.e.m. with individual values from HC-Ag (n = 13), pRD-Ag (n = 13), HC-N (n = 3) and pRD-N (n = 1). (e) Detection of T-bet+ B cells. Gates show the CD21lowT-bet+ B cells in a representative from HC-Ag and a pRD-Ag patient. Frequencies are indicted. (f) Gating for CD38int, CD38−, CD27+ and DN (CD27−IgD−) B cells. Plot show gatings from a representative HC-Ag and a pRD-Ag patient. (g) T-bet expression in CD38int, CD38−, CD27+ and DN (CD27−IgD−) B cells. Overlaid histogram plots depict the T-bet expression by CD38int, CD38−, CD27+ and DN (CD27−IgD−) B cells in a representative HC-Ag subject (black) and a pRD-Ag patient (red) in comparison to HC total B cell (filled gray). Expression levels are indicated as gMFI values. (h) T-bet expression in CD38int, CD38−, CD27+ and CD27−IgD− populations. Expression of FcRL4, FcRL5, CD85j and CXCR3 ABC-specific markers (i), CD95 (j) and BAFF-R (k) in CD38int, CD38−, CD27+ and CD27−IgD− B cells. Plots for e-g were obtained from a single experiment performed simultaneously on HC-Ags (n = 10) and pRD-Ag patients (n = 4). Data for h was obtained from a single experiment performed simultaneously on HC-Ags (n = 10) and pRD-Ag patients (n = 4). Data for i-k (except for CXCR3) was obtained from a single experiment performed simultaneously on HC-Ags (n = 13) and pRD-Ag patients (n = 5). Data for i CXCR3 panel was obtained from a single experiment performed simultaneously on HC-Ags (n = 6) and pRD-Ag patients (n = 4). Data for each graph are normalized and shown as in Fig. 1e and shown as mean±s.e.m. with individual values depicted. Statistical analyses were performed using two-sided unpaired Student’s t-test.

