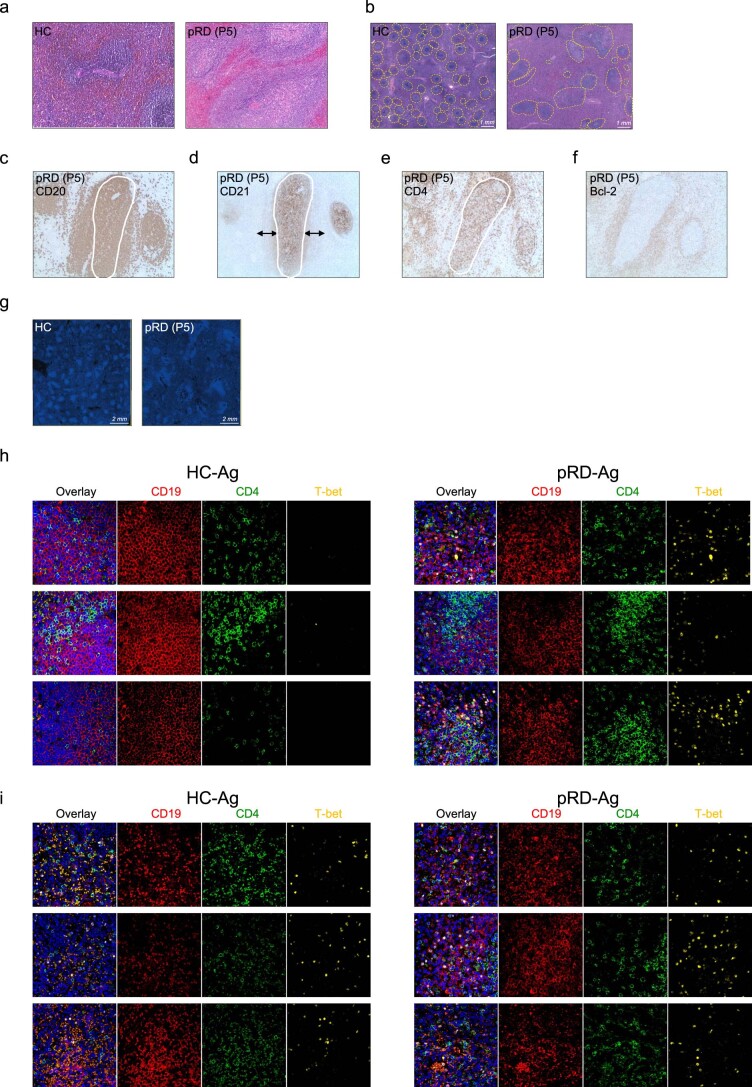
Extended Data Fig. 5. Spleen pathology.
(a) Hematoxylin and eosin staining of spleen sections from a HC and a pRD-Ag subject. 40x magnifications. (b) Hematoxylin and eosin staining of spleen sections from a HC and a pRD-Ag subject. Follicles are depicted with yellow dashed line. 10x magnifications. (c-f) Chromogenic staining for CD20 (c), CD21 (d), CD4 (e) and Bcl-2(f) in a pRD-Ag subject. 50x magnifications. (g) Cellular distribution shown by DAPI (nucleus) staining by confocal microscopy. 10x magnification. (h-i) Representative multi-color immunofluorescence images for T-bet expression in follicular (Fo) (h) and extrafollicular (EF) (i) areas. Overlay shows CD19 (red), CD4 (green), T-bet (yellow) and DAPI (blue); and CD19 (red), CD4 (green) and T-bet (yellow) expressions are shown separately. 60x magnification. All images were obtained from the spleen sections of a single experiments performed simultaneously for a HC-Ag and a pRD-Ag (P5) subject.

