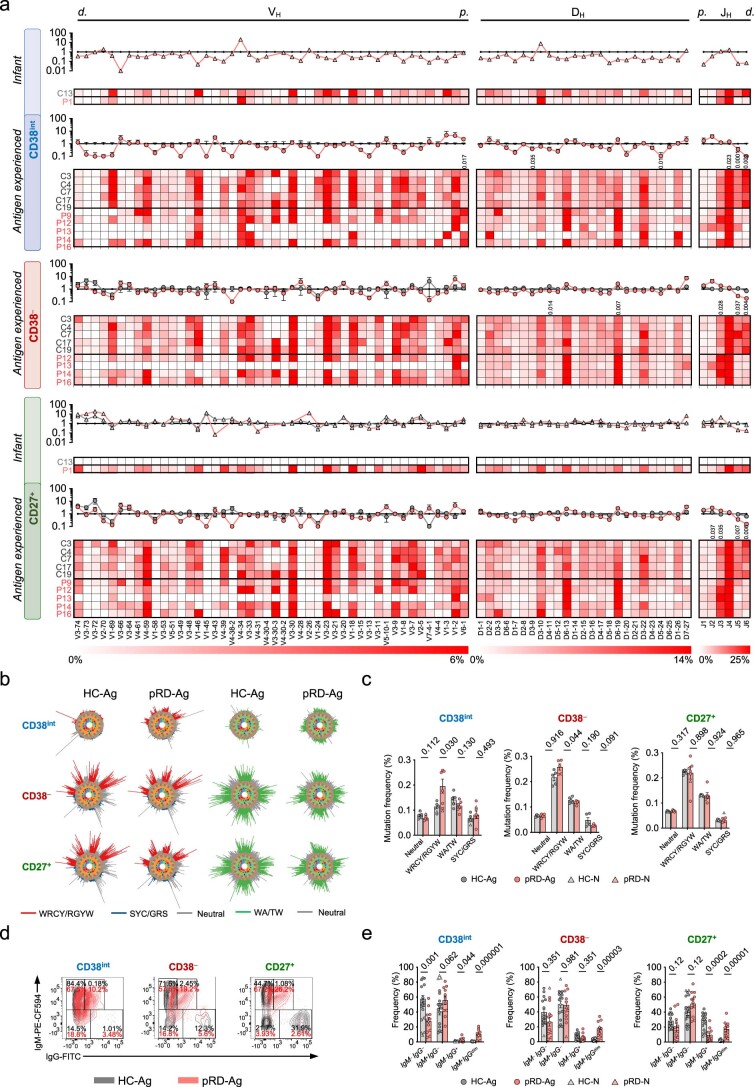
Extended Data Fig. 7. BCR repertoire.
(a) IGH-V-D-J gene usage from CD38int, CD38− and CD27+ B cells. Heat maps represent the frequency of each VH, -DH and -JH gene by subjects, HC-N (n = 1), HC-Ag (n = 5), pRD-N (n = 1), pRD-Ag (n = 5-6) shown as mean±s.e.m. with individual values. Subject IDs are depicted on the left side of each heat map; and compartments as CD38int, CD38− and CD27+ B cells depicted with blue, red, and green on the left. Ig VH, -DH and -JH genes are listed on the bottom by their chromosomal order. Color scales represent gene frequencies for each family separately. d.: distal genes, p.: proximal genes. Statistical analysis was performed using two-sided unpaired t-test with multiple comparison (Holm-Šídák method) to compare VH, -DH and -JH gene usage between HC-Ag and pRD-Ag donors and P values are indicated when reached significance. Plot inserts shows changes in gene usages in CD38− and CD27+ cell compartments compared to the values of HC-Ags in CD38int compartment (horizontal black line) for HCs (gray) and pRD patients (red), infant donors (triangles), and antigen-experienced donors (circles). (b) “Hedgehog” plots – targeted hot- and coldspot sequence motifs. Frequencies of WRCY/RGYW (red), SYC/GRS (blue), WA/TW (green) and neutral (gray) mutations are visualized. (c) Enumeration of different SHM hot- and coldspots in CD38int, CD38− and CD27+ B cells. Graph shows mutation frequency in different SHM hot- and coldspots from HC-N (n = 1), HC-Ag (n = 5), pRD-N (n = 1), pRD-Ag (n = 5) shown as mean±s.e.m. with individual values. (d) IgG surface expression. Contour plots show the surface expression of IgG and IgM of a representative HC-Ag (dark gray) and a pRD-Ag patient (red) overlayed from their CD38int, CD38− and CD27+ B cells separately. (e) Frequency of B cells based on IgM and IgG surface marker expression. Graphs show frequency of IgM+ IgG−, IgM+ IgGdim, IgM− IgG+, IgM− IgG− from CD38int, CD38− and CD27+ B cells and shown as mean±s.e.m. with individual values. Statistical analysis was performed on Ag-experienced subjects using Mann–Whitney U test. Data for d-e was obtained from HC-N (n = 3), HC-Ag (n = 15), pRD-N (n = 1), pRD-Ag (n = 11).

