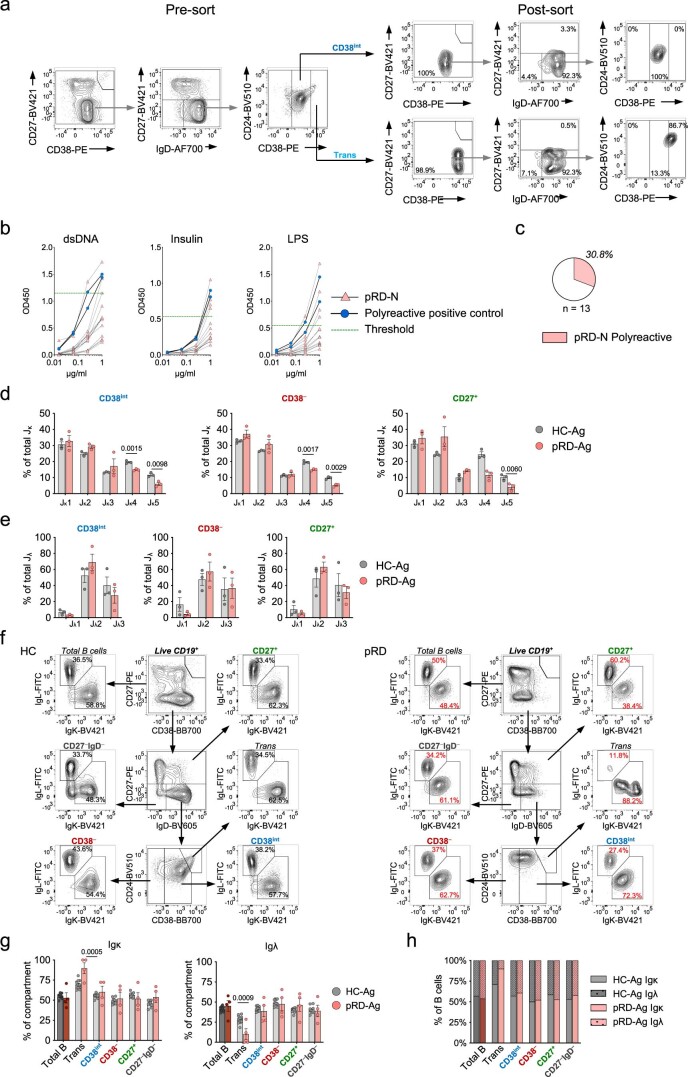
Extended Data Fig. 8. Impaired central B cell tolerance.
(a) Gating and sort purity of index single-cell sorted new emigrant transitional and CD38int B cells. Pre-sort plots show the original composition of B cells in the samples before single-cell sort. Post-sort plots show the phenotype of the 46 or 94 new emigrant or CD38int B cells index single-cell sorted into 96-well plate. Gating is shown for a representative HC-Ag subject, experiment was performed for HC-Ag (n = 3), pRD-Ag (n = 5) and pRD-N (n = 1). (b) Binding of Abs from new emigrant transitional B cells to dsDNA, insulin and LPS. Abs cloned from new emigrant transitional B cells of pRD-N patient (P1) were tested for anti-dsDNA, insulin and LPS reactivity in serial dilution. Thick black lines with blue circles show binding of the two positive controls used in each assay to determine threshold for positive reactivity (mean of positive controls minus 2 SD at 1.0 µg/ml). Threshold for positive reactivity is shown with green dashed line. (c) Frequency of polyreactive new emigrant transitional B cell clones. The frequency of non-polyreactive (open area) and polyreactive (filled area) clones is summarized in pie chart. Abs were considered polyreactive when they recognized at least two of the three antigens tested. The total number of clones tested is indicated. (d-e). Frequency of Jκ (d) and Jλ (e) light chain gene segments in repertoires. Data are shown as mean±s.e.m. with individual values for each gene segments in CD38int, CD38− and CD27+ B cell repertoires of pRD patients (n = 3) and HCs (n = 3). Statistical analysis was performed using Two-sided unpaired t-test with multiple comparison. (f) Gating for kappa and lambda light chain expression. Representative plots are shown for a HC-Ag and pRD-Ag patient. (g) Kappa and lambda light chain expression. Data are shown as mean±s.e.m. with individual values. Statistical analysis was performed using two-sided unpaired Student’s t-test. (h) Ratios of kappa:lambda light chain expression. Graph shows the relative ratio of kappa:lambda light chain expression as means. Data for f-h was obtained from a single experiment performed simultaneously on HC-Ags (n = 12) and pRD-Ag (n = 4) subjects.

