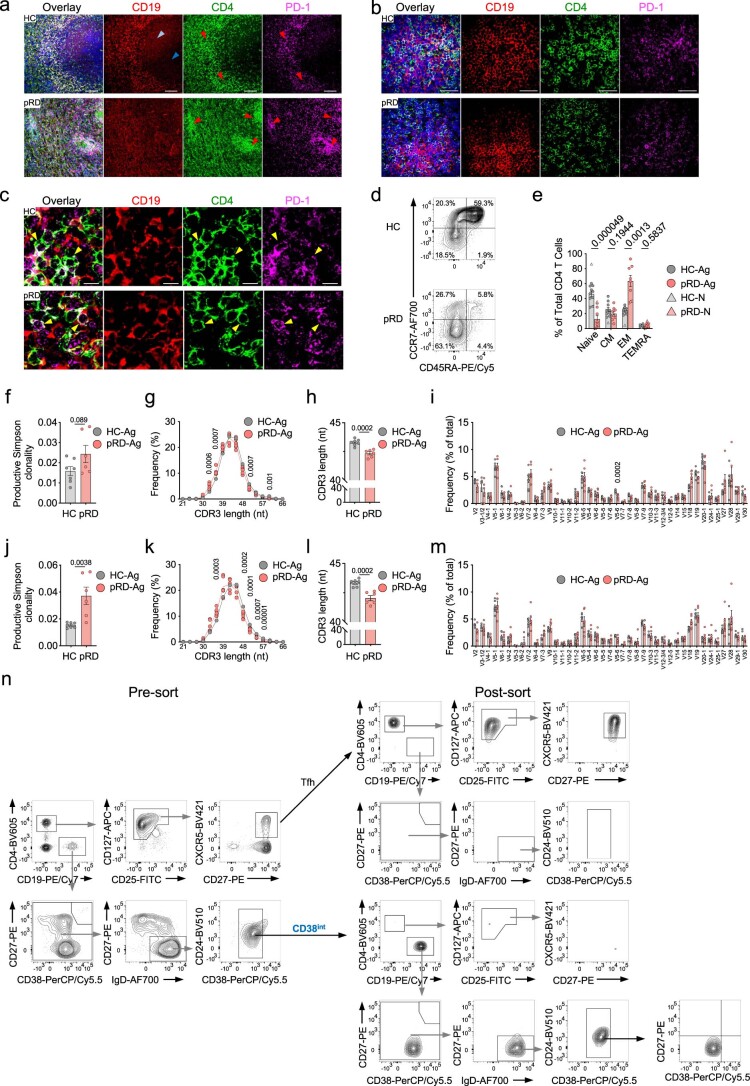
Extended Data Fig. 10. T cells.
(a) Representative multi-color immunofluorescence image of spleen sections. Overlayed markers are shown as CD19 (red), CD4 (green), PD-1 (violet), and DAPI (blue) staining performed simultaneously in a single experiment for spleen sections from a HC and a pRD patient. Red arrow: T cell region, light blue arrow: GC light zone, dark blue arrow: GC dark zone. Magnification: 20x. (b) PD-1 expression. Magnification: 60x. (c) PD-1 expression. Magnification: 60x, yellow arrow depicts Tfh cells (CD4+PD-1+). (d) Gating for naive, CM, EM TEMRA TH cell subsets. (e) Enumeration of T cell subsets. Data were obtained from HC-N (n = 1), HC-Ags (n = 10), pRD-N (n = 1) and pRD-Ags (n = 8) subjects. (f) Productive Simpson clonality of cTfh TCR-Vβ repertoires. (g) CDR3 length distribution in cTfh TCR-Vβ repertoires. Means of HCs and pRD patients are depicted as a black and red line, respectively. Individual values are shown for the patients. nt – nucleotides. (h) CDR3 length of cTfh TCR-Vβ repertoires. (i) Differential usage of V genes in cTfh TCR-Vβ repertoires. Relative frequency of TCR-Vβ family usages is shown. (j) Productive Simpson clonality of Treg TCR-Vβ repertoires. (k) CDR3 length distribution in Treg TCR-Vβ repertoires. Means of HCs and pRD patients are depicted as a black and red line, respectively. Individual values are shown for the patients. nt – nucleotides. (l) CDR3 length of Treg TCR-Vβ repertoires. (m) Differential usage of V genes in Treg TCR-Vβ repertoires. Relative frequency of TCR-Vβ family usages is shown. All TCR-Vβ repertoire data were obtained on HC-Ag (n = 7) and pRD-Ag (n = 6) subjects. (n) Gating strategy for sorted CD38int B and cTfh cells. Gating and sort purity of batch sorted CD38int B cells and cTfh cells for co-culture assay shown on a representative HC-Ag subject. Four independent experiments were performed with one HC-Ag (n = 4) and one pRD-Ag (n = 4) subjects in each. Data for e-f h-j and l-m are shown as mean±s.e.m. with individual values. Statistical analysis was performed using two-sided unpaired Student’s t-test for panel f-h and j-l, or Mann–Whitney U test with Holm-Šídák multiple comparison for panel e, i and m.

