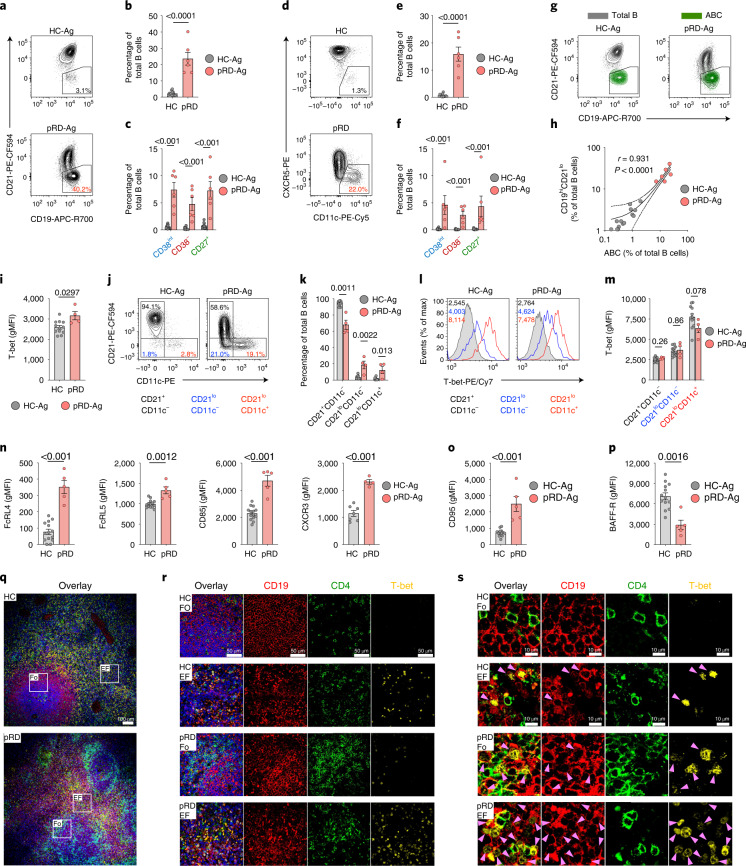
Fig. 2. T-bet+ B cells.
a, Detection of CD19hiCD21lo B cells. b,c, Gating for CD19hiCD21lo B cells in a representative HC-Ag and patient with pRD-Ag. Fraction of CD19hiCD21lo B cells in total (b) and CD38int, CD38− and CD27+ B cells (c) in HC-Ags (n = 14) and patients with pRD-Ag (n = 6). d, Detection of ABCs. Gating for ABCs in a representative HC-Ag and patient with pRD-Ag. e,f, Fraction of ABCs in total (e) and CD38int, CD38− and CD27+ B cells (f) in HC-Ags (n = 14) and patients with pRD-Ag (n = 6). g, Distribution of ABCs in conventional and CD19hiCD21lo B cells. Contour plots show total B cells (gray), gate depicts CD19highCD21low B cells and ABCs are overlayed (green) in a representative HC-Ag and patient with pRD-Ag. h, Correlation between CD19hiCD21lo B cells and ABCs. Linear regression line is shown with 95% confidence intervals, Pearson r and P values are shown. Data were obtained from HC-Ags (gray, n = 14) and patients with pRD-Ag (red, n = 6). i, T-bet expressions in total B cells are shown as gMFIs. j,k, Detection (j) and fraction (k) of CD21+CD11c−, CD21loCD11c− and CD21loCD11c+ B cell populations. Gating is shown in a representative HC-Ag and patient with pRD-Ag. l,m, T-bet expression in CD21+CD11c−, CD21loCD11c− and CD21loCD11c+ B cells in a representative HC-Ag and patient with pRD-Ag (l) and shown as gMFIs (m). n–p, Expressions of FcRL4, FcRL5, CD85j and CXCR3 (n), CD95 (o) and BAFF-R (p) in total B cells are shown as gMFIs. Data for i–p were obtained from HC-Ags (n = 7–14) and patients with pRD-Ag (n = 4–5). Data for b,c,e,f,k–o are shown as mean ± s.e.m. with individual values depicted. Statistical analyses were performed using two-sided unpaired Student’s t-test for data on b,c,e,f,I–o or Mann–Whitney U-test with multiple comparison (Holm–Šídák method) for k. q, Overlayed markers (CD19, CD4, T-bet and 4,6-diamidino-2-phenylindole (DAPI)) in a HC-Ags and patients with pRD-Ag. Magnification ×10. Follicular (Fo) and extrafollicular (EF) areas are indicated that were used for higher magnifications. r, T-bet expression by Fo and EF areas. Magnification ×60. s, T-bet expression in B cells by Fo and EF areas. Arrow shows T-bet+ B cells. Magnification ×60.

