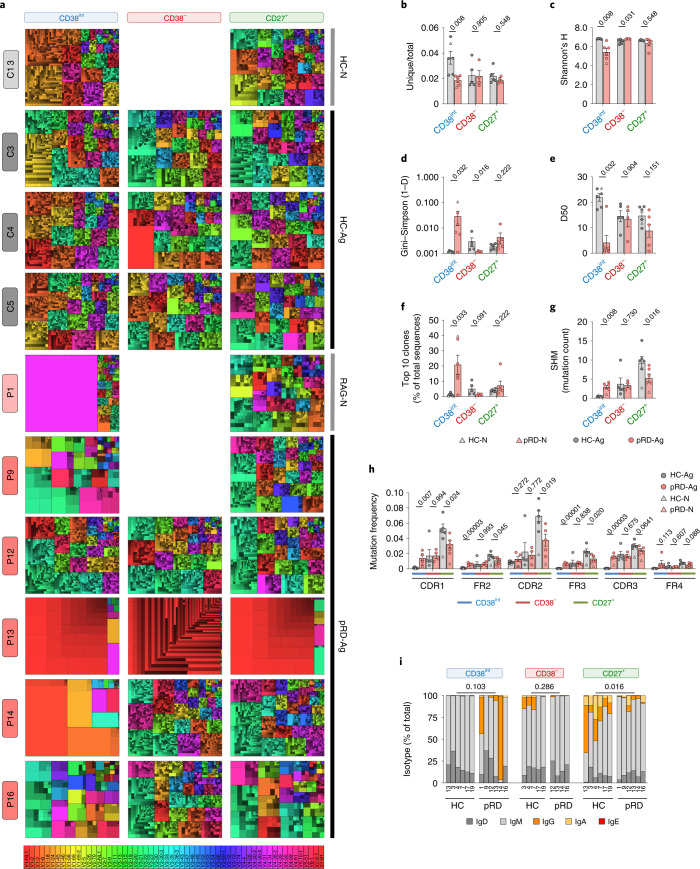
Fig. 3. BCR repertoire characteristics in patients with pRD.
a, Treemap representation of the diversity and clonality of immunoglobulin heavy-chain repertoires.Each rectangle represents an immunoglobulin heavy-chain clonotype and the size of rectangles is proportional to the relative frequency of each clone in the entire repertoire. Distinct clones sharing the same VH gene are displayed using altered brightness of the same hue indicated by the color scale. Thick borders and colors assign clones into the corresponding VH gene families. Each treemap represents the most abundant 2,500 clones. One antigen-naive healthy infant (HC-N), three representative antigen-exposed HCs (HC-Ag), the antigen-naive infant patient (pRD-N) and the antigen-exposed patients with pRD (pRD-Ag, n = 5) are shown. Labels on the left show participant IDs. Labels on the top indicate B cell compartments. No sufficient amount of CD38− cells was obtained from the infant donors and P9 for sequencing. b, Ratio of unique and total sequence counts. c–e, Shannon’s H (c), Gini–Simpson (1 − D) (d) and Diversity 50 (D50) (e) diversity indices. f, Cumulative frequency of the ten most abundant clones. g, Frequency of SHM in the V segment. Bars represent mean ± s.e.m. for each group with the individual values indicated. h, Mutation distribution. Graph shows replacement mutation frequencies in CDR and FR regions in CD38int, CD38− and CD27+ B cells. i, Isotype distribution. Stacked columns show the percentage of each Ig class in each repertoire by individuals and B cell compartments. Numbers depict participant IDs. Data for each analysis were obtained from HC-Ags (n = 5), HC-N (n = 1), pRD-Ag (n = 5) and pRD-N (n = 1). Statistical analyses were performed only on individuals with antigens (HC-Ag versus pRD-Ag) using a Mann–Whitney U-test. For i, unswitched (IgD + IgM) and switched (IgG + IgA + IgE) sequences were compared.

