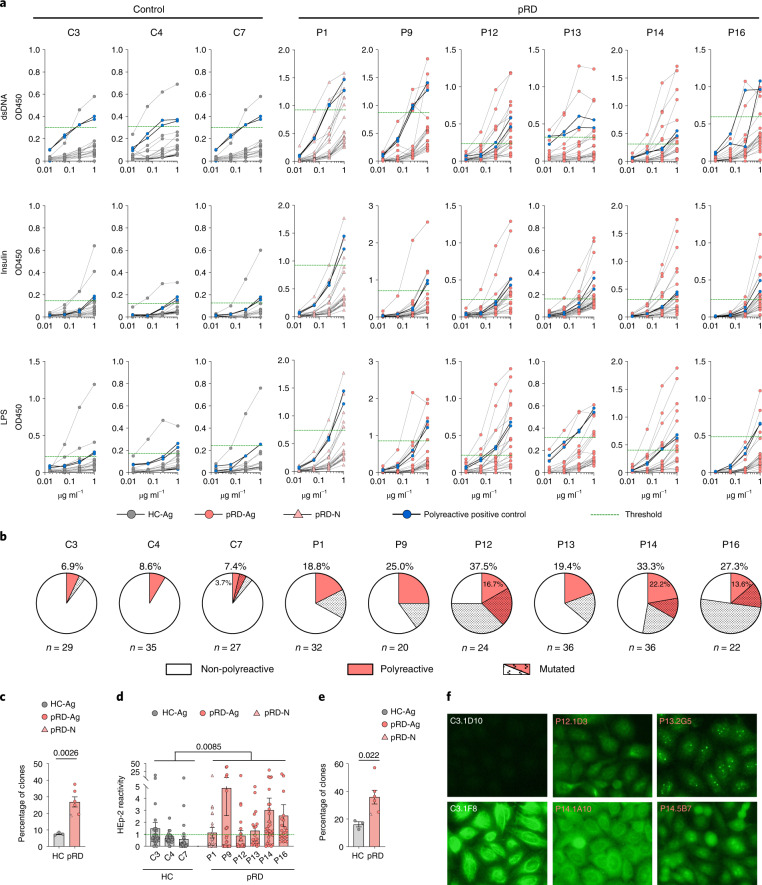
Fig. 4. Impaired peripheral B cell tolerance in patients with pRD.
a, Polyreactivity of CD38int B cells. Antibodies cloned from CD38int B cells were tested for anti-double-stranded DNA (dsDNA), insulin and lipopolysaccharide (LPS) reactivity in serial dilution. Binding of 20 randomly selected clones is shown on each graph. Thick black lines with blue circles show binding of the two positive controls used in each assay to determine the threshold for positive reactivity (mean of positive controls minus 2 s.d. at 1.0 µg ml−1). Threshold for positive reactivity is shown by a green dashed line. b, Frequency of polyreactive clones by individuals. Pie charts depict the frequency of non-polyreactive (white) and polyreactive (red) clones for each individual and the percentage of polyreactive clones are shown. The fraction of sequences carrying at least two mutations compared to their corresponding germline versions is depicted by dotted patterns. c, Frequency of polyreactivity. d, HEp-2 reactivity of CD38int B cell clones. Cloned antibodies were tested in 5.0 µg ml−1 concentration for anti-HEp-2 cell line lysate with the two positive controls used in each assay. Blank corrected absorbance values were normalized with the mean of positive controls minus 2 s.d. and values above 1 (green dashed line) were considered positive for HEp-2 reactivity. e, Frequency of HEp-2 reactivity. For c–e data are shown as mean ± s.e.m. with individual values and statistical analyses performed on individuals with antigens (HC-Ag versus pRD-Ag) using a two-sided unpaired Student’s t-test. Antibodies were cloned and tested from HC-Ags (n = 3), pRD-N (n = 1) and patients with pRD-Ag (n = 5). The total number of B cell clones tested is indicated for each individual in b. f, HEp-2 immunofluorescence. Cloned antibodies were used in HEp-2 immunofluorescence assays to show target antigen distribution. Representative images for negative and positive stainings are shown from one HC-Ag and three pRD-AG individuals. Individual and antibody clone IDs are shown. Magnification ×16.

