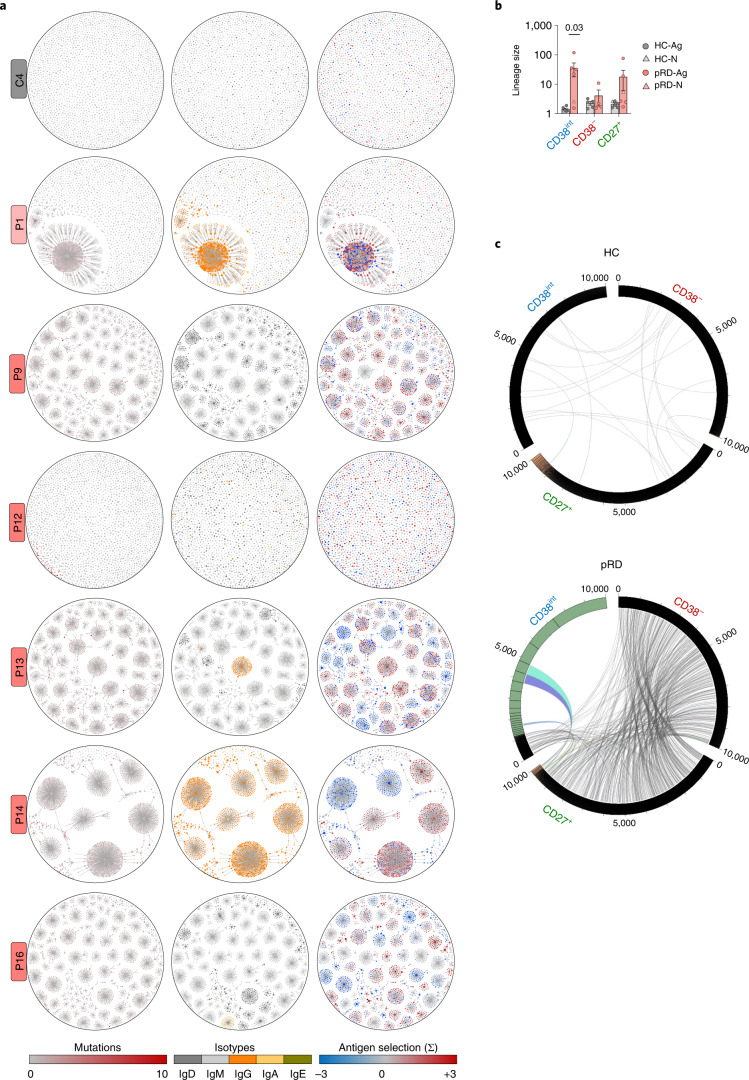
Fig. 6. Clonal connectivity and diversification.
a, Clonal expansion with somatic hypermutation, isotype switches and antigen selection in CD38int compartment. Repertoire data were randomly downsampled to 2,500 unique sequences from CD38int compartments of each donor and plotted on lineage network diagrams. Nodes represents unique sequences, where the size of the nodes is proportional to the abundance of the given sequence in the repertoire on a logarithmic scale and lines depict clonal relatedness. Therefore, nodes in each cluster belong to the same clonotype and differ in mutations in their V segments. Accumulation of mutations (left), isotypes (middle) and antigen selection values (right) are shown for each clone as indicated below the diagrams. One representative adult HC-Ag, the infant pRD-N and the patients with pRD-Ag (n = 5) are shown, labels on the left indicate individual IDs. b, Clonotype size (intra-compartmental clonal connectivity). Average number of clonal connections by repertoires (CD38int, CD38− and CD27+) Data are shown as mean ± s.e.m. for HC-N (n = 1), HC-Ag (n = 5), pRD-N (n = 1) and pRD-Ag (n = 5). Mann–Whitney U-test was performed on individuals who were Ag-experienced. c, Clonal sharing between CD38int, CD38− and CD27+ repertoires. The 10,000 randomly selected sequences from each repertoire were arranged on circular plots from a representative HC-Ag and patients with pRD-Ag. Numbers indicate sequence IDs; segmentation of rings indicates clonal size. Clones belonging to the same lineages in distinct compartments are connected depicting clonal connections. Colored connection lines indicate lineages accounting for sequences found in the largest clones up to 20% of total sequences. Plots are representative of a HC-Ag and pRD-Ag. Data from additional investigated individuals are shown in Extended Data Fig. 9c.

