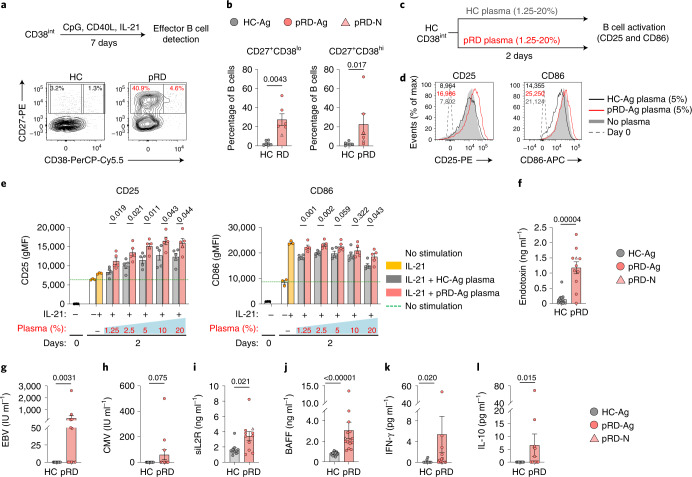
Fig. 7. B cell activation signals.
a, In vitro CD38int B cell differentiation. Sorted CD38int B cells were activated with CpG, CD40L and IL-21. Differentiated cells (CD27+CD38lo and CD27+CD38hi) were quantified on day 7. Experimental design is shown and contour plots are representative of an individual with HC-Ag and a patient with pRD-Ag from six independent experiment. b, Enumeration of effector cells. The proportion of CD27+CD38lo and CD27+CD38hi from HC-Ags (n = 6), pRD-N (P1) (n = 1) and patients with pRD-Ag (n = 5) are shown as percentage of total live B cells in the culture. c, Experimental design for testing B cell activation by plasma. Sorted CD38int HC B cells were cultured in vitro in the presence of IL-21 and plasma from either a patient with pRD-Ag (n = 5) or independent HC-Ag (n = 5) and analyzed on day 2 for CD25 and CD86 expression. d, Activation of sorted CD38int B cells with plasma. Surface expression of CD25 and CD86 are shown as overlaid histogram plots depicting representative samples of HC-Ag plasma-stimulated, patient with pRD-Ag plasma-stimulated and unstimulated HC. Dashed line indicated marker expression level on day 0. Expression levels are indicated as gMFIs. e, Enumeration of B cell activation. Graphs show expression of CD25 and CD86 at day 0 and 2 days of stimulation with HC-Ags (n = 5) or patients with pRD-Ag (n = 6) plasma at the indicated plasma concentration in culture medium. Data for d,e were obtained from a single experiment performed on all plasma samples simultaneously. f, Plasma endotoxin levels. HC-Ags (n = 13), pRD-N (P1) (n = 1) and pRD-Ags (n = 10). g,h, Plasma virus levels. Epstein–Barr nuclear antigen and CMV titers were detected in the plasma of HC-Ags (n = 15), pRD-N (P1) (n = 1) and pRD-Ags (n = 12). i, Plasma soluble IL-2R levels. HC-Ags (n = 11), pRD-N (P1) (n = 1) and pRD-Ags (n = 10). j, Plasma BAFF levels. HC-Ags (n = 20), pRD-N (P1) (n = 1) and pRD-Ags (n = 14). k,l, Plasma IFN-γ and IL-10. HC-Ags (n = 11), pRD-N (P1) (n = 1) and pRD-Ags (n = 14). Data are shown as mean ± s.e.m. with individual values depicted on each graph. For statistical analysis Mann–Whitney U-test was performed for b; and two-sided unpaired Student’s t-test was used for e–l to compare patients with pRD-Ag to individuals with HC-Ag.

