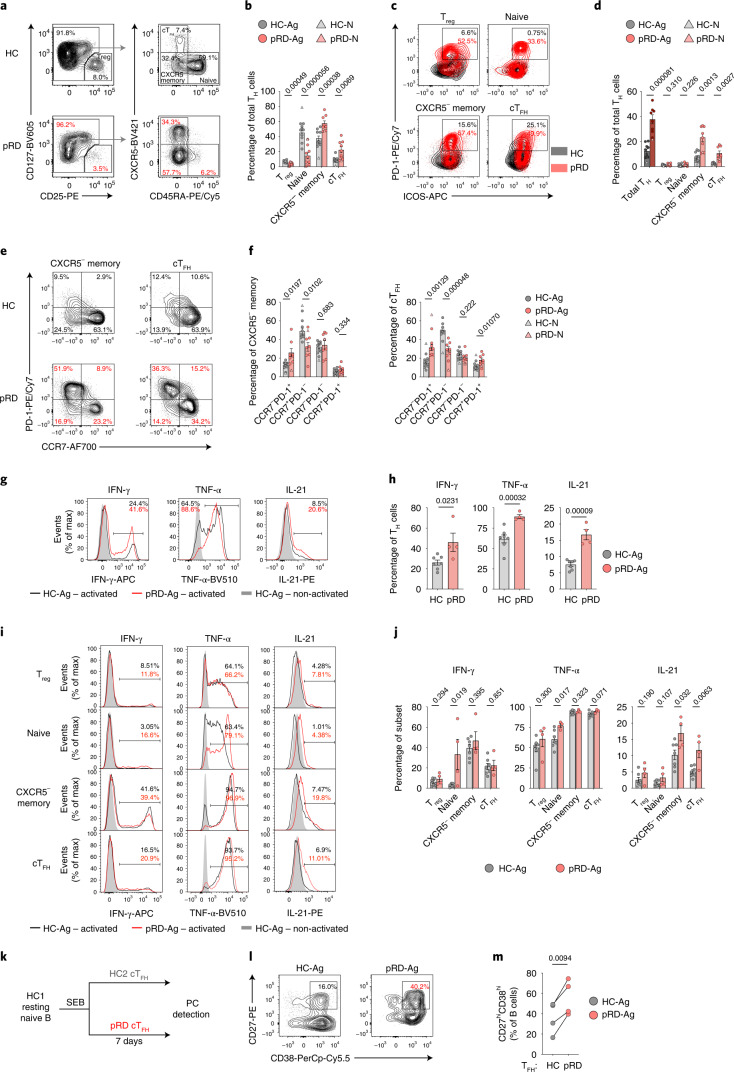
Fig. 8. Characterization of TH cells.
a, Gating for Treg, cTFH, CXCR5− memory and naive TH cells. TH subsets are shown from a live lymphocyte CD4+ gate in representative HC-Ag and a patient with pRD-Ag. b, Frequencies of TH subsets. c, PD-1+ICOS+ cells in TH subsets. Overlayed plots show PD-1+ICOS+ cells by subsets in a representative HC-Ag and an individual with pRD-Ag. d, Proportion of PD-1+ICOS+ TH cells. Graphs show frequencies of PD-1+ICOS+ cells in total TH cells and by subsets. e, Correlation of PD-1 and CCR7 expression. Fraction of CCR7−PD-1+, CCR7+PD-1−, CCR7−PD-1− and CCR7+PD-1+ are shown in CXCR5− memory and cTFH cells in a representative HC-Ag and a patient with pRD-Ag. f, CXCR5− memory and cTFH populations fractioned by PD-1 and CCR7 expression. Data for b,d,f are shown as mean ± s.e.m. with individual values from HC-N (n = 1), HC-Ags (n = 10), pRD-N (n = 1) and pRD-Ags (n = 8). g, In vitro IFN-γ, TNF-α and IL-21 production by total TH cells. Data are shown as overlaid histogram plots depicting a representative stimulated individual with HC-Ag and a patient with pRD-Ag; and an unstimulated HC-Ag from live lymphocyte CD4+ gate. h, Frequencies of IFN-γ, TNF-α and IL-21 positive TH cells. i, In vitro IFN-γ, TNF-α and IL-21 production by TH subsets. Data are shown as in g by TH subsets. j, Frequency of IFN-γ, TNF-α and IL-21 positive cells by TH subsets. Data for h and j are shown as mean ± s.e.m. with individual values from HC-Ags (n = 7) and pRD-Ags (n = 4). Data for g–j were obtained from four independent experiments. For statistical analysis Mann–Whitney U-test with Holm–Šídák multiple comparison were performed for b and two-sided unpaired Student’s t-test for d,f,h,j to compare HC-Ag and pRD-Ag. k, Approach to assess cTFH function. l, Detection of PCs. PCs were identified from the live lymphocyte gate in a representative HC-Ag and an individual with pRD-Ag. m, Proportion of PCs in culture. PC frequencies induced by HC-Ag (n = 4) or pRD-Ag (n = 4). cTFH cells are shown as individual values and statistical analyses were performed using two-sided paired Student’s t-test. Data for l,m were obtained from four independent experiments.

