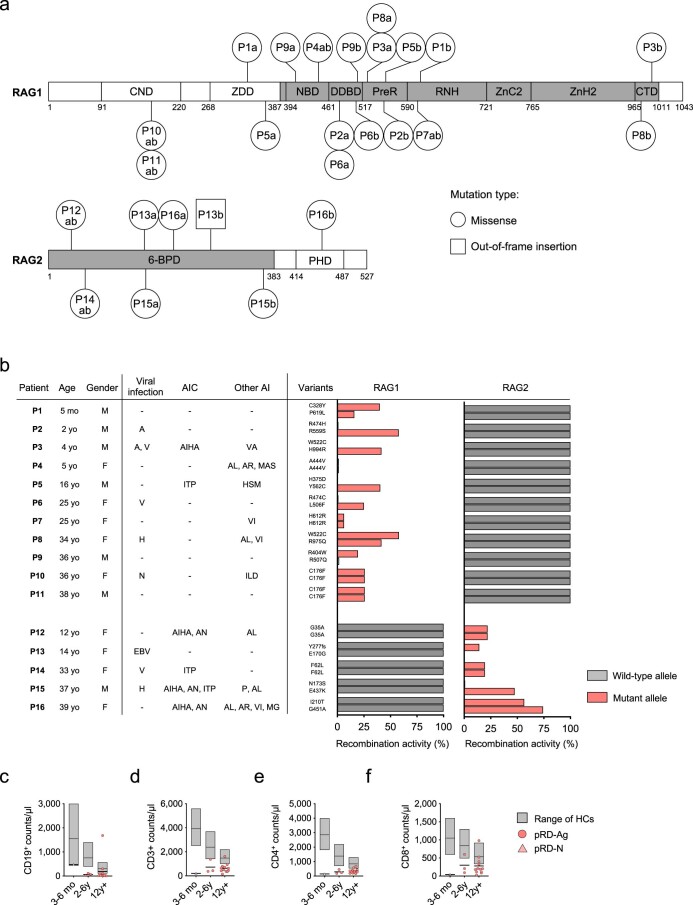
Extended Data Fig. 1. RAG1/2 mutations, recombinase activity and clinical features.
(a) Distribution of mutations in the RAG1/2 genes. Mutations are indicated for each patient as patient ID and mutant alleles, with a and b separately for compound heterozygous or ab for homozygous variants. Core and non-core regions of the RAG proteins are denoted by gray and white, respectively. RAG1 domains: central non-core (CND), zinc dimerization (ZDD), nonamer-binding (NBD), dimerization and DNA-binding (DDBD), pre-RNase H (PreR), catalytic RNase H (RNH), zinc-binding (with cysteine and histidine zinc-binding residues (ZnC2 and ZnH2)) and carboxy-terminal (CTD). The RAG2 core region is a six-bladed propeller domain (6-BPD). Non-core RAG2 contains a plant homology domain (PHD). Numbers indicate amino acids at domain borders. (b) Residual RAG recombinase activities by variants. RAG recombinase activities are shown as percentage of wild-type variants for both alleles (see Supplementary Table 2 for details). Patient information with clinical presentations is shown (M: male, F: female, A: adenovirus, V: varicella, H: herpesvirus, EBV: Epstein-Bar virus, AIHA: autoimmune hemolytic anemia, ITP: immune/idiopathic thrombocytopenic purpura, AN: autoimmune neutropenia, VA: vasculitis, AL: alopecia, AR: arthritis, MAS: macrophage activation syndrome, HSM: hepatosplenomegaly, VI: vitiligo, ILD: interstitial lung disease, P: psoriasis, MG: myasthenia gravis. (c-f) Lymphocyte counts in pRD patients. Graphs show CD19+, CD3+, CD4+, CD8+ lymphocyte counts in the peripheral blood of pRD-N (n = 1) and pRD-Ag patients (n = 16) in age groups 3-6 month, 2-6 years and over 12 years, compared to published aged-matched healthy ranges. Values for HCs are presented as floating bars with medians and 10th percentiles and 90th percentiles shown obtained as 3-6 month (n = 81), 2-6 years (n = 90) and over 12 years (n = 90), from published data. Values for patients are depicted individually.

