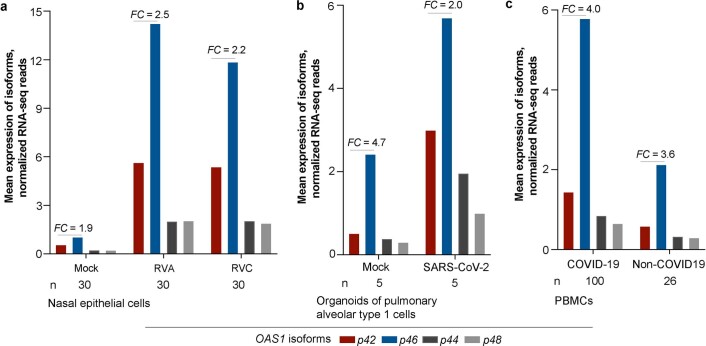
Extended Data Fig. 8. Mean expression levels of OAS1 isoforms in nasal epithelial cells, pulmonary alveolar cells and PBMCs.
a-c, Expression of OAS1 isoforms was analyzed in RNA-seq data of nasal epithelial cells (SRA: PRJNA627860) (a), organoids of pulmonary alveolar type 1 cells (SRA: PRJNA673197) (b), and PBMCs (SRA: PRJNA660067) (c). The bar graphs show the mean expression levels of each OAS1 isoform normalized as described in Extended Data Figure 7. The expression of OAS1-p46 is higher than OAS1-p42 in all cell types and conditions tested.

