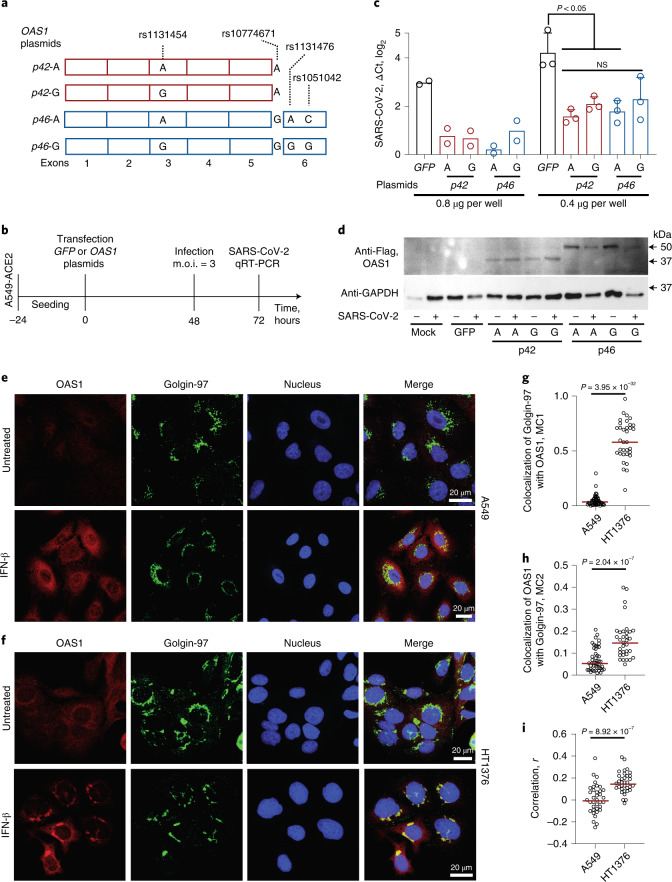
Fig. 2. Anti-SARS-CoV-2 activity and subcellular localization of OAS1-p42 and p46 isoforms.
a, Description of OAS1-p42 and OAS1-p46 plasmids with Flag-tags. b, Experimental outline: plasmids were transiently transfected in A549-ACE2 cells, followed by infection with SARS-CoV-2 and qRT-PCR for viral detection. c, SARS-CoV-2 load in A549-ACE2 cells transfected with OAS1 or GFP plasmids in six-well plates with 0.4 μg per well (n = 2, P values and error bars are not applicable) or 0.8 μg per well (n = 3, P values are for unpaired, two-sided Student’s t tests, the data are presented as means and standard deviation (s.d.)). Expression of SARS-CoV-2 was detected by qRT-PCR and normalized to the expression of an endogenous control (HPRT1). Full results are presented in Supplementary Table 5. The experiment was independently repeated three times with comparable results; the results of one experiment are presented. d, A representative western blot showing similar expression of all Flag-tagged OAS1 protein isoforms in mock and SARS-CoV-2-infected A549-ACE2 cells, with GAPDH used as a loading control. e,f, Representative confocal images for endogenous OAS1 expression in untreated and interferon β (IFN-β)-treated A549 cells (rs10774671-AA, OAS1-p42, cytosolic expression) and HT1376 (rs10774671-GG, OAS1-p46, enrichment in trans-Golgi compartment); OAS1 (red), Golgin-97 (green) and nuclei (4,6-diamidino-2-phenylindole (DAPI), blue). Scale bars, 20 µm. g, Mander’s coefficient 1 (MC1) for colocalization of Golgin-97 with OAS1 in confocal images. h, Mander’s coefficient 2 (MC2) for colocalization of OAS1 with Golgin-97 in confocal images. i, Overall correlation (Pearson’s r) between colocalization of Golgin-97 and OAS1 expression in confocal images. The results presented as individual points and group means are based on data collected from 5-7 fields of view from one of two comparable independent experiments. P values are for nonparametric, two-sided Mann–Whitney U tests. The full western blot is provided as Source Data.

