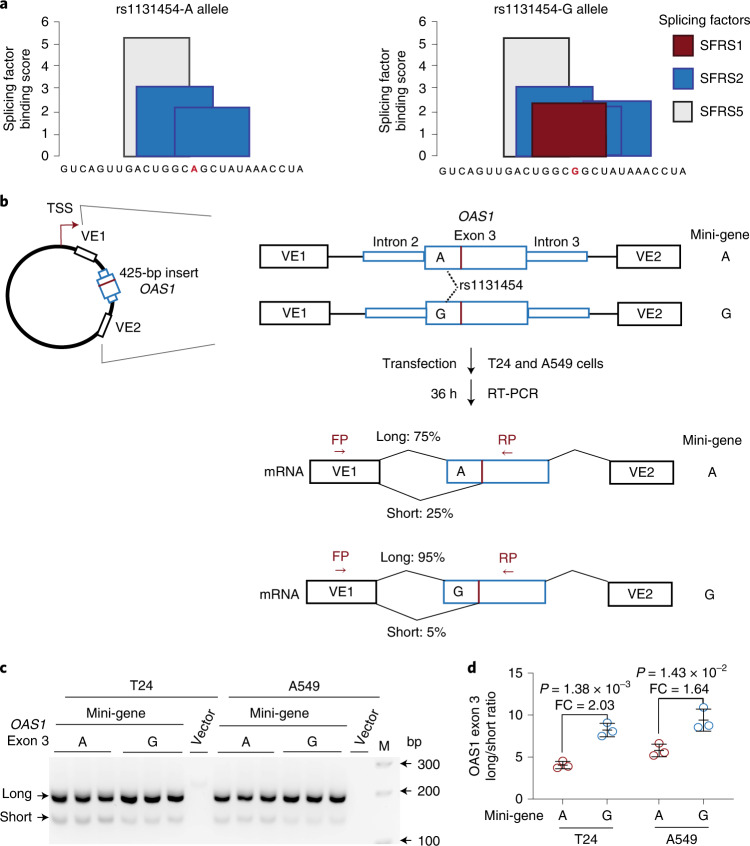
Fig. 5. Exontrap assays demonstrate the functional effect of rs1131454 on OAS1 exon 3 splicing.
a, In silico prediction of allele-specific splicing factor binding sites within OAS1 exon 3. Only rs1131454-G allele creates a binding site for SFRS1 splicing factor; binding sites for SFRS2 are created by both alleles, with three or two sites created in the presence of non-risk G or risk A alleles, respectively. b, Experimental outline: description of allele-specific mini-genes with OAS1 exon 3 inserts, transfection in T24 and A549 cells, and splicing ratios of amplicons detected by RT-PCR with FP and RP primers. c, Representative agarose gel showing splicing events of mini-genes detected by RT-PCR in T24 and A549 cells. Vector corresponds to negative control, and M corresponds to 100-bp size marker. Upper and lower bands correspond to long and short exon 3 splicing events with vector exon 1 (VE1). No alternative splicing events were identified between exon 3 insert and VE2. Each mini-gene was analyzed in three biological replicates, and the results of one of two independent experiments are shown. d, The ratios of long/short OAS1 exon 3 expression quantified by densitometry of agarose gel bands. Splicing of long exon 3 is significantly higher from the mini-gene with non-risk rs1131454-G allele compared to the mini-gene with risk rs1131454-A allele. Fold changes (FC) were calculated from the splicing ratios. The dot plots are presented with means and s.d.; P values are for unpaired, two-sided Student’s t tests. The full agarose gel is provided as Source Data.

