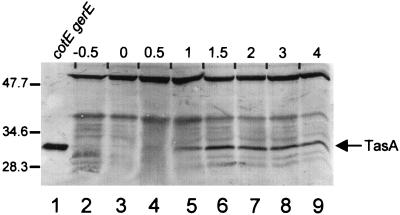
FIG. 4.
Western blot analysis (SDS–15% polyacrylamide gel) of TasA steady-state levels. Lane 1 contains an extract of cotEΔ::cat gerE36 spores (to indicate the position of TasA). Extracts were prepared 30 min before sporulation (lane 2) and at 30-min intervals until the second hour of sporulation (lanes 3 to 7) and then at 1-h intervals (lanes 8 and 9). The arrow indicates the position of TasA. The numbers above the blot indicate the time at which the samples were prepared, relative to the beginning of sporulation. Molecular masses are indicated in kilodaltons.

