Fig. 1.
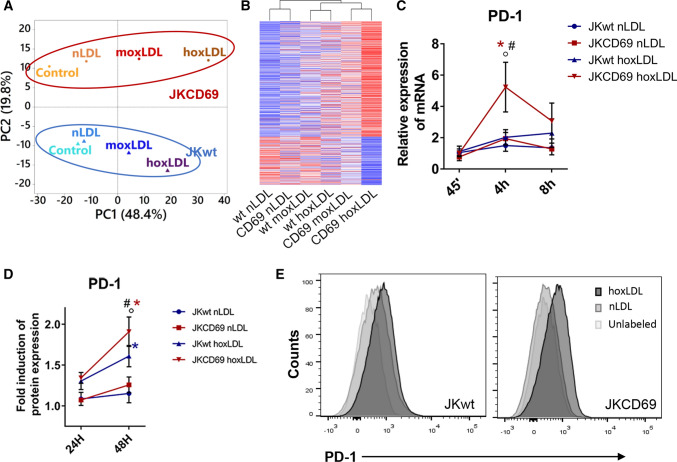
OxLDL-CD69 binding induces a differential transcriptional response increasing the PD-1 expression. A Principal component analysis (PCA) performed using the up- and downregulated genes from the RNA-Seq data of each incubation condition. The proportion of variability explained by each principal component (PC1 and PC2) are included in the axis. Blue samples correspond to JKwt and red samples to JKCD69. (nLDL: native LDL; moxLDL: moderately oxidized LDL; hoxLDL. highly oxidized LDL). B The oxidation degree of oxLDL induces a differential transcriptomic response. Heatmap based on the fold change of 577 upregulated and 242 downregulated genes in JKCD69 with the higher level of oxLDL. Data are shown as Ln (x + 1) and are clustered using correlation distance and average linkage. Up- and downregulated genes are shown in red and blue respectively. C Relative expression of PD-1 mRNA in JKCD69 and JKwt treated with hoxLDL. Data are mean ± SD (n = 3) and were analysed with two-way ANOVA (Tukey post hoc test). *Indicates significant differences (P < 0.05) with the treatment for each cell line (native vs. oxLDL), # JKCD69 vs. JKwt in the same condition, ◦ significant differences respect the previous time (45’ vs. 4 h, 4 h vs. 8 h). D Mean fluorescence intensity of PD-1 in both cell lines at different time points. Data are mean ± SD (n = 3) and were analysed with two-way ANOVA (Bonferroni post hoc test). *Indicates significant differences (P < 0.05) in the treatment for each cell line (native vs oxLDL), # JKCD69 vs. JKwt in the same condition, ◦ significant differences respect the time. E Histograms of a representative experiment of the induction of PD-1 in JKCD69 and JKwt after 48 h incubated with LDLs

