Figure 2.
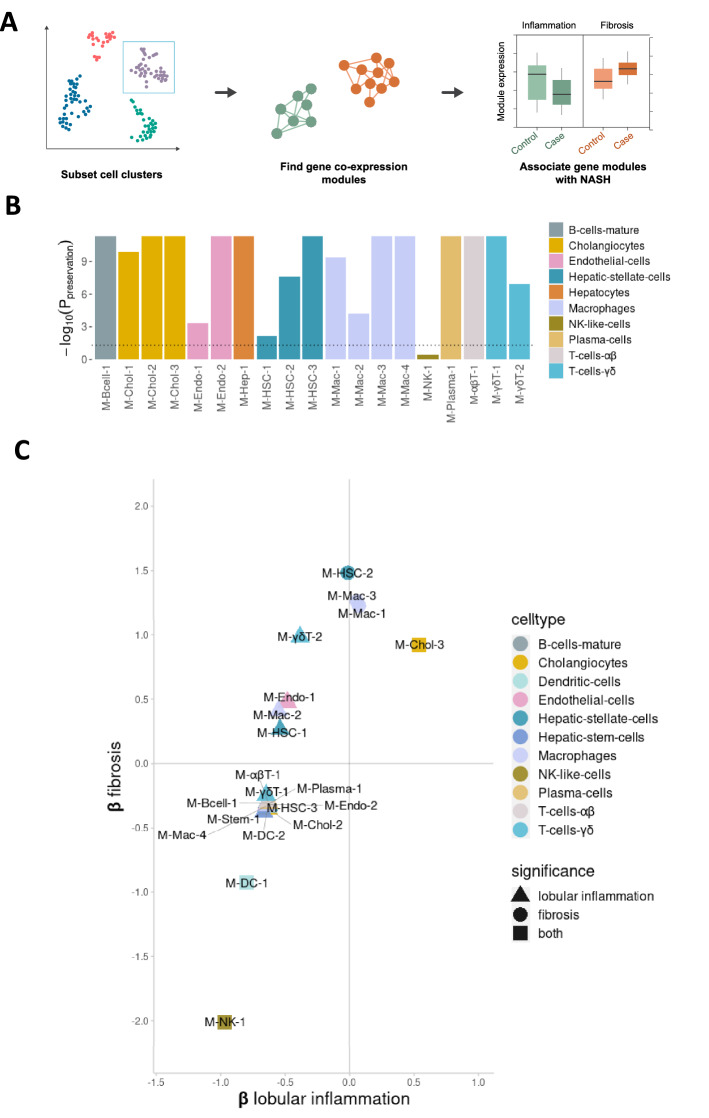
Expression of co-expressed gene modules is associated with both inflammation and fibrosis in NASH. (A) Weighted gene co-expression network analysis workflow used to identify disease-associated gene modules. For each of the 12 major cell types, co-expression gene modules were identified. After quality control, 22 high-confidence modules were tested for association between module activity and levels of fibrosis, lobular inflammation and steatosis using a published RNA-seq data set with 24 healthy controls and 160 fatty liver disease samples. (B) Bar plot showing strength of module co-expression preservation in the MacParland et al. scRNA-seq liver data set. P-values were corrected for multiple testing (Benjamini-Hochberg) and the dotted line marks the significance threshold (P < 0.05). Modules are coloured by the cell cluster in which they were identified. Modules from Dendritic cells and Hepatic stem cells, which were absent in the MacParland et al. data set, were omitted in this step. (C) Cell type-specific gene modules whose activity pattern is associated, either positively or negatively, with the level of inflammation and fibrosis in fatty liver disease, in multivariate linear regression models with module activity as the outcome variable. The vertical and horizontal axes correspond to standard deviation differences in module activity for each unit change in lobular inflammation (encoded as 0, 1 or 2) or fibrosis (0 or 1). The plot includes only modules with statistically significant association to at least one condition using bootstrap percentile P-values corrected for multiple testing within each phenotype (Benjamini-Hochberg). Modules are coloured by cell cluster.

