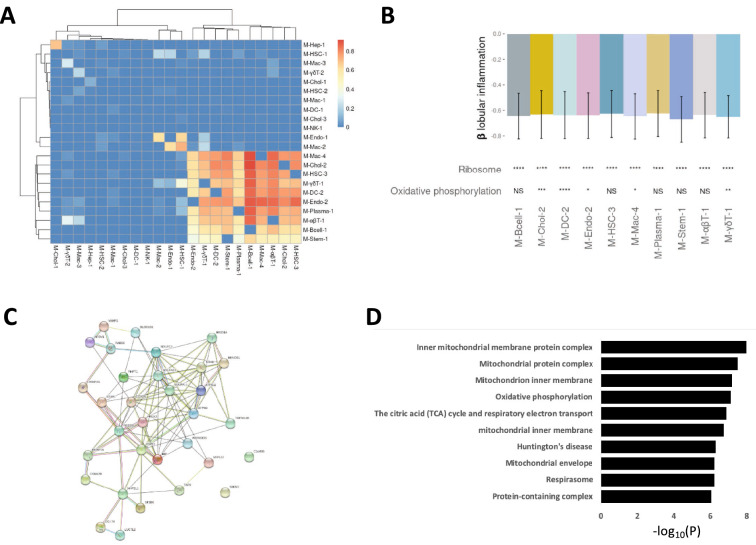
Figure 3.
Pervasive down-regulation of genes related to ribosomal translation in inflammation. (A) Heatmap showing the proportion of genes in a module (columns) shared with other modules (rows). The overlap of a cluster with itself was set to 0 and columns and rows were clustered hierarchically. (B) Top; bar plot shows standard deviation differences in module activity for each unit change in lobular inflammation (encoded as 0, 1 or 2) in a multivariate linear regression model with module activity as the outcome variable. Error bars show 0.95 confidence intervals, obtained using bootstrap percentiles with bootstrap replicates. Bottom; module enrichment for three top-shared KEGG terms identified using GERR. (C) Protein–protein interaction network of the 32 overlapping genes correlated with oxidative phosphorylation. (D) Bar plot showing the top ten associated gene sets from Gene Ontology, based on the 32 overlapping genes correlated with oxidative phosphorylation. Significance notation refers to P-values obtained using a hypergeometric test and correcting for multiple testing (Benjamini-Hochberg, n = 30). ns: P > 0.05; *: P ≤ 0.05; **: P ≤ 0.01; ***: P ≤ 0.001; ****: P ≤ 0.0001.

