Figure 4.
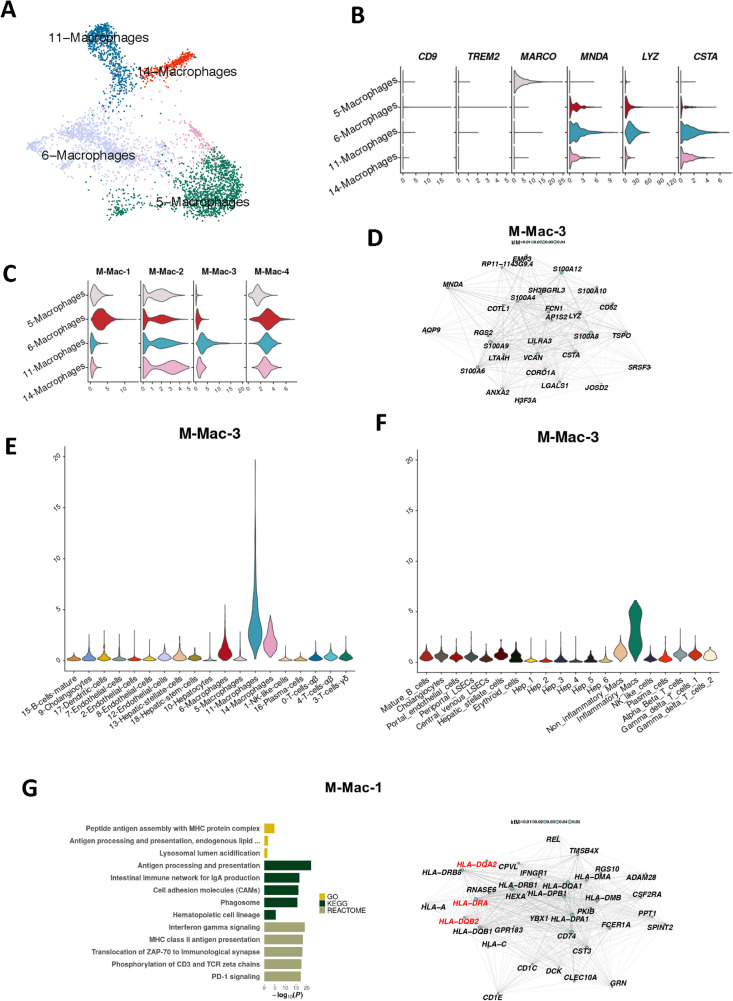
A subset of pro-fibrotic macrophages associates with the M-Mac-3 module. (A) UMAP projection of the four macrophage clusters. (B) Violin plots of normalised and batch-corrected expression of macrophage specific marker genes. (C) Violin plots of the activity of macrophage modules, where some modules appear to be cluster-specific. (D) M-Mac-3, of which the 30 most central genes are seen in the network diagram. (E–F) Normalised and batch corrected gene expression of M-Mac-3 in the single-cell RNA-seq samples from individuals with NASH (E) and normalised (but not batch corrected) gene expression in normal liver samples from the MacParland et al. data set (F). (G) M-Mac-1, of which the 30 most central genes are seen in the network diagram (right panel), enriched for processes related to antigen presentation (left panel). In the network diagrams, node sizes represent gene centrality in the module (‘kIM’), and edge widths represent the strength of gene–gene co-expression. For the bar plot, gene sets from the Gene Ontology (GO), Kyoto Encyclopaedia of Genes and Genomes (KEGG) and Reactome databases were queried. Only significant results were plotted (P < 0.05).

