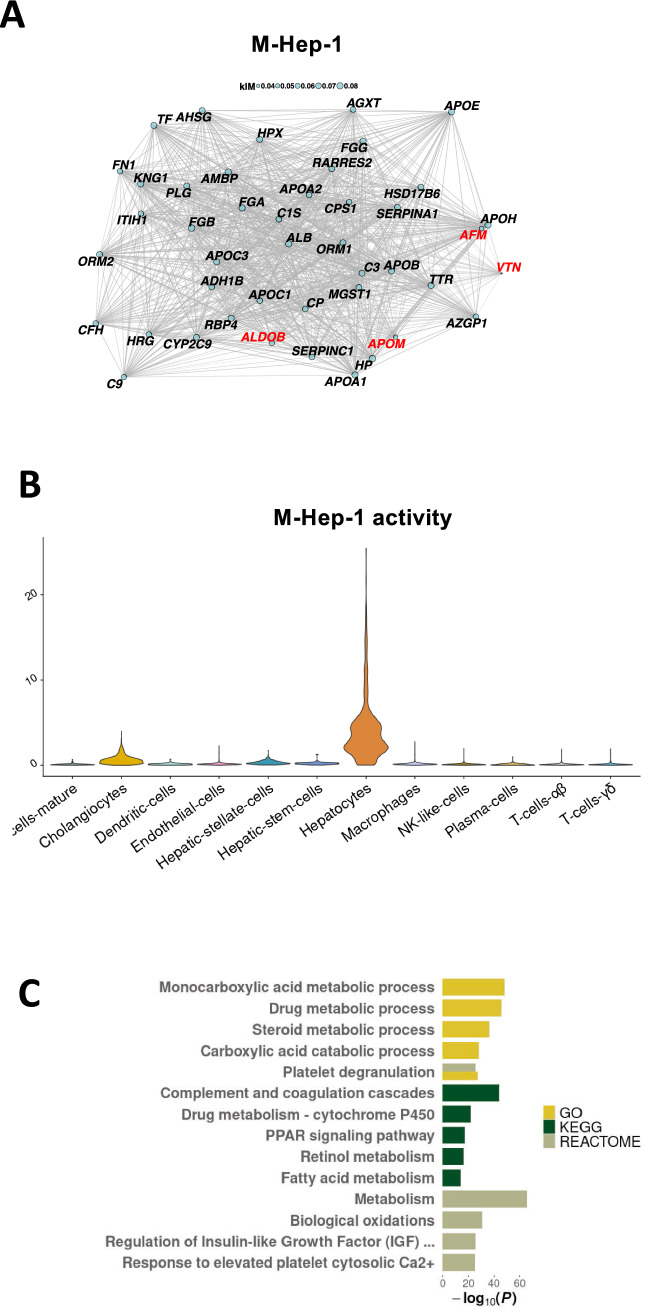
Figure 6.
WGCNA reveals that multiple circulating markers of NAFLD are co-regulated. (A) Network plot showing the 30 most central genes of M-Hep-8, as well as ALDOB, APOM, VTN, and AFM, four out of six recently identified NAFLD plasma proteome markers. Edge width is proportional to gene–gene co-expression and node size is proportional to gene ‘kIM’ centrality (Methods). (B) Violin plot showing the activity of M-Hep-1 in 12 cell clusters. (C) The biological function of module M-Hep-1, identified through gene set analysis using the Gene Ontology, Kyoto Encyclopedia of Genes and Genomes and Reactome databases. Up to five of the top hits from each database shown. Only significant results were plotted (P < 0.05).

