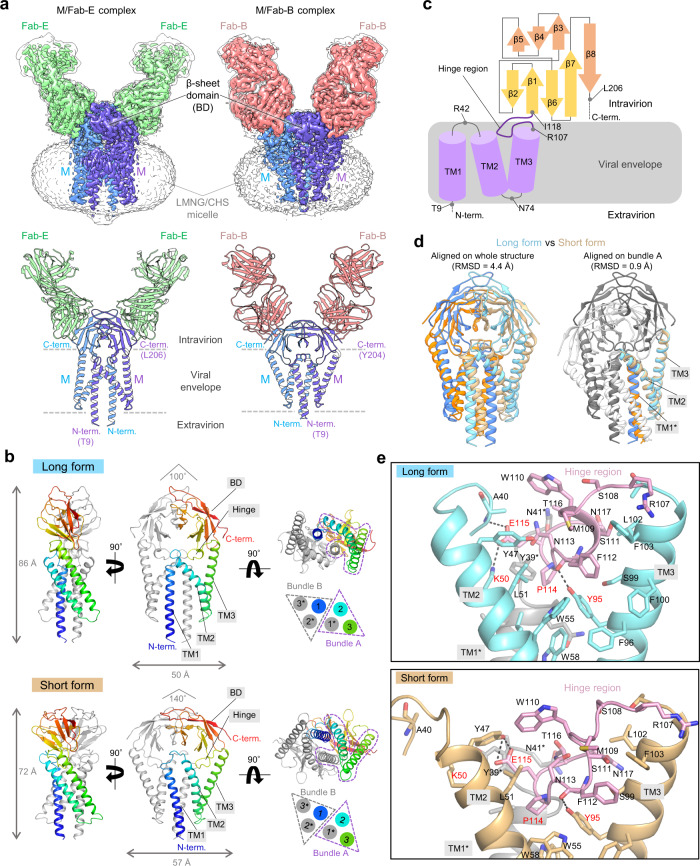
Fig. 2. Cryo-EM structures of M protein dimer.
a Cryo-EM maps (upper) and ribbon models (lower) of M/Fab-E and M/Fab-B complexes. Unsharpened maps are shown in transparent light gray color (M/Fab-E complex: level = 0.08; M/Fab-B complex: level = 0.35), and B-factor-sharpened maps are show in multiple colors (M/Fab-E complex: level = 0.28; M/Fab-B complex: level = 0.75). M protein protomers, Fab-E, and Fab-B, are colored in purple, blue, green, and pink, respectively. b Structures of M protein dimer in the long form (upper) and the short form (lower) are shown from the side (left), front (middle), and bottom (right) views. One protomer of M protein is colored in a rainbow, and the other is light gray. Schematic views of the arrangement of six TM helices are shown on the lower right. TM1*, TM2, and TM3 formed one bundle. Throughout this paper, asterisks are used to indicate structural parts from the second M protein protomer. c Schematic view of the M protein protomer. Secondary structure elements and hinge regions are indicated. The disordered N-term and C-term regions are indicated by dashed lines. d Structure comparison between the long form (blue and cyan) and short form (orange and beige). The structures were aligned either according to the whole structure (left) or bundle A (right). e Detailed views of the interactions between the hinge region and bundle A in the long (upper) and short (lower) forms. The key residues are indicated in red. Dashed lines represent hydrogen bonds or salt bridges.

