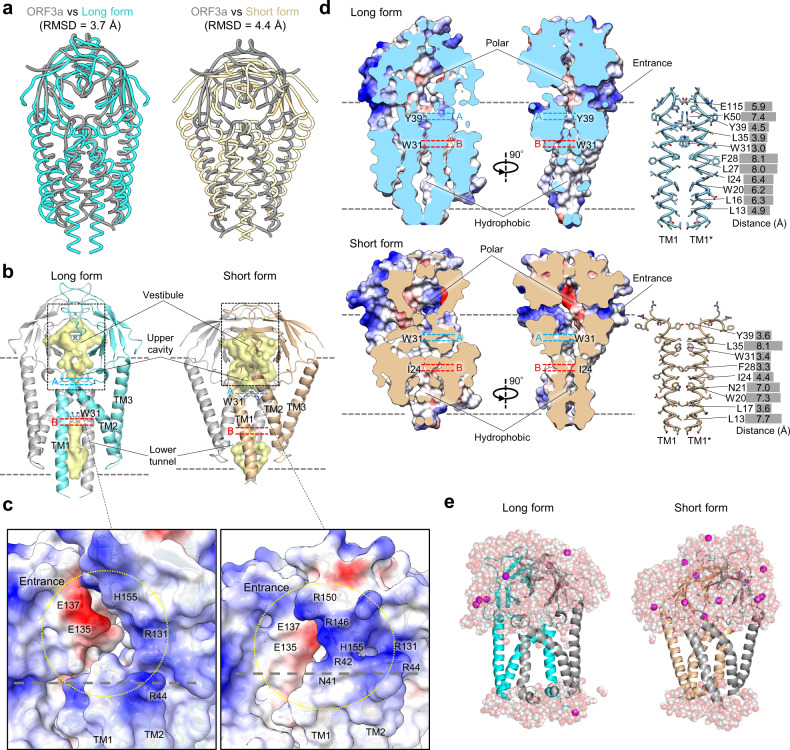
Fig. 3. The M protein resembles the ion channel ORF3a.
a Structural comparisons of the long form (cyan) and the short form (beige) of SARS-CoV-2 M protein dimer with SARS-CoV-2 ORF3a (gray) (PDB: 6XDC). b The inner surface of the M protein dimers (vestibule, upper cavity, and lower tunnel) calculated using Pymol are shown in yellow. The bottom of the upper cavities and the top of the lower tunnel are indicated as a, b, respectively. The W31 side chain is shown using a stick representation. c Close-up views of the entrances to the vestibules above the upper cavity. Half-transparent electrostatic surface potentials and side chains of charged residues are shown. The purple dashed lines indicate the approximate positions of the lipid bilayer. d Electrostatic surface potentials of the long and short forms and cross-sections along the C2 axis (left). Detailed views of the interface between TM1 and TM1* are shown, including the distances between each residue pair (right). e Snapshots of the MD simulation results of the long form (left) and the short form (right).

