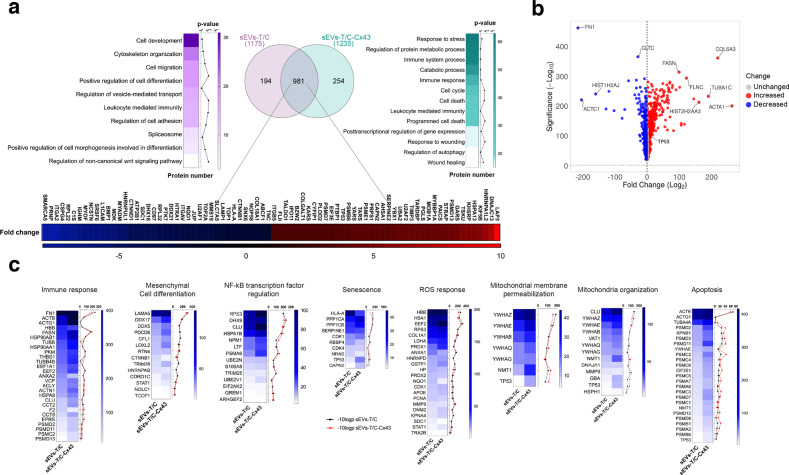
Fig. 5. Proteomic analysis of proteins isolated from sEVs derived from T/C-28a2 chondrocytes with (sEVs-T/C-Cx43) or without (sEVs-T/C) Cx43.
a sEVs were isolated by ultracentrifugation and the protein content was analysed by mass spectrometry (TripleTOF 6600 System). Venn diagram showing the number of proteins quantified in both groups (sEVs-T/C in the left, sEVs-T/C-Cx43 in the right), and the heatmap of upregulated and downregulated proteins in the bottom. b Volcano plot (VolcaNoseR) illustrating the spectral count fold change and its significance in the common proteins shared by sEVs-T/C and sEVs-T/C-Cx43. Overrepresented proteins in sEVs-T/C-Cx43 are displayed as red dots, while blue dots represent proteins that are increased in the sEVs-T/C group. c Heatmaps representing the spectral count values and the −10log p-value of proteins involved in NF-kß transcription factor regulation, mitochondrial membrane permeabilization and organization, ROS response, immune response, apoptosis, mesenchymal cell differentiation and senescence. Black lines correspond to −10log p-value of sEVs-T/C and red lines to −10log p-value sEVs-T/C-Cx43.

