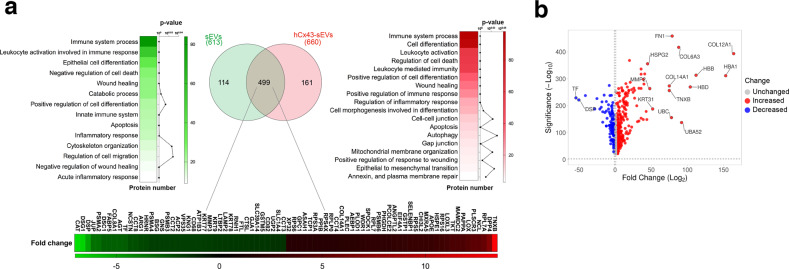
Fig. 6. Proteomic analysis of proteins isolated from sEVs derived from untreated human osteoarthritic chondrocytes (sEVs) or Cx43-enriched after oligomycin treatment (hCx43-sEVs).
a Venn diagram indicating the number of proteins identified in the proteomic analysis, and the heatmap of enriched pathways present in each group (n = 4). 114 proteins were exclusively found in sEVs isolated from OA-derived chondrocytes (left) and 161 were only identified in hCx43-sEVs (right). 499 common proteins (middle circle) were identified in both samples. Heatmaps represent significant function and pathways enriched in exclusive and common detected proteins, and analysed using STRING enrichment analysis (Gene Ontology and KEGG) based on quantitatively upregulated and downregulated proteins. b Volcano plot (VolcaNoseR) illustrating the correlation of fold change derived from the semiquantitative parameter spectral count and its significance, of the common proteins presents in both groups (sEVs from OA-derived chondrocytes-derived and sEVs derived from hCx43).

